The constituencies of Israel
June 6, 2024
This project tries to simulate what the latest Israeli election would have been like under a single-member electorate system. If we use a “first-past-the-post” element in each electorate, we end up with a system very similar to the one that chooses the House of Commons of the United Kingdom; and since we want to retain the current size of the Knesset, we assume 120 constituencies, which we create explicitly on the map using data from the Knesset and census websites.
The actual Israeli system is almost the complete opposite of the British or Australian ones. It elects its Knesset by roughly the purest proportional representation there is: the whole country is a single constituency, all 120 seats handed out in proportion to the national vote, with only a 3.25% threshold to clear. Of course, this entirely eliminates the regional elements that make British and Australian politics interesting, and I have long wondered how different its politics would look chopped into local districts instead.
The plan was to carve Israel into 120 single-member constituencies of roughly equal population, drop the real votes from the March 2021 election (the 24th Knesset) into them, and see what parliament falls out. Like in my other simulations in this vein, and as could be expected, it turns out that the interesting question is not really who wins, but rather how much the answer changes depending on the rule you use to turn votes into seats. So once the map existed, I ran the same ballots through first-past-the-post (like the UK), through instant-runoff (like Australia), and some in-between multi-member systems which many of the European democracies use.
The hardest part was drawing the districts fairly, and this turned out to be quite a nice piece of computational geometry: exactly the problem real electoral commissions wrestle with.
We are going to use three data sources in this project.
- Statistical areas. A list of “statistical areas”, which are the smallest districts the Israeli government collects high-level demographic data on, and for which there is an accompanying shapefile on the statistics bureau’s website. There are 3,187 of them around the country. Crucially, they do not include many of the settlements in the West Bank, but they do include the Golan Heights, East Jerusalem, and several of the large settlement blocs.
- Votes by polling place. A table of votes for each of the 39 ptakim, or symbols representing party tickets in the elections for the 24th Knesset in March 2021, aggregated by kalpi, or polling place. There are over 12,000 of these around the country, including all over the West Bank, in every settlement where Israeli citizens live.
- Addresses of polling places. A list of all the polling places and their physical address, in Hebrew. This is also available from the Knesset’s website.
Statistical areas
We read the file containing the “layer” of the statistical areas. This is a Geodatabase file containing geometric information about each area, stored as a polygon in the geometry column, some metadata about each area, and demographic statistics (breakdowns by gender and age, and whether the area is populated by Jews or not). Of the demographic data, we only require the total population column for this project, to allow us to cluster statistical areas together into electorates, so we only select the metadata, the total population and the geometry.
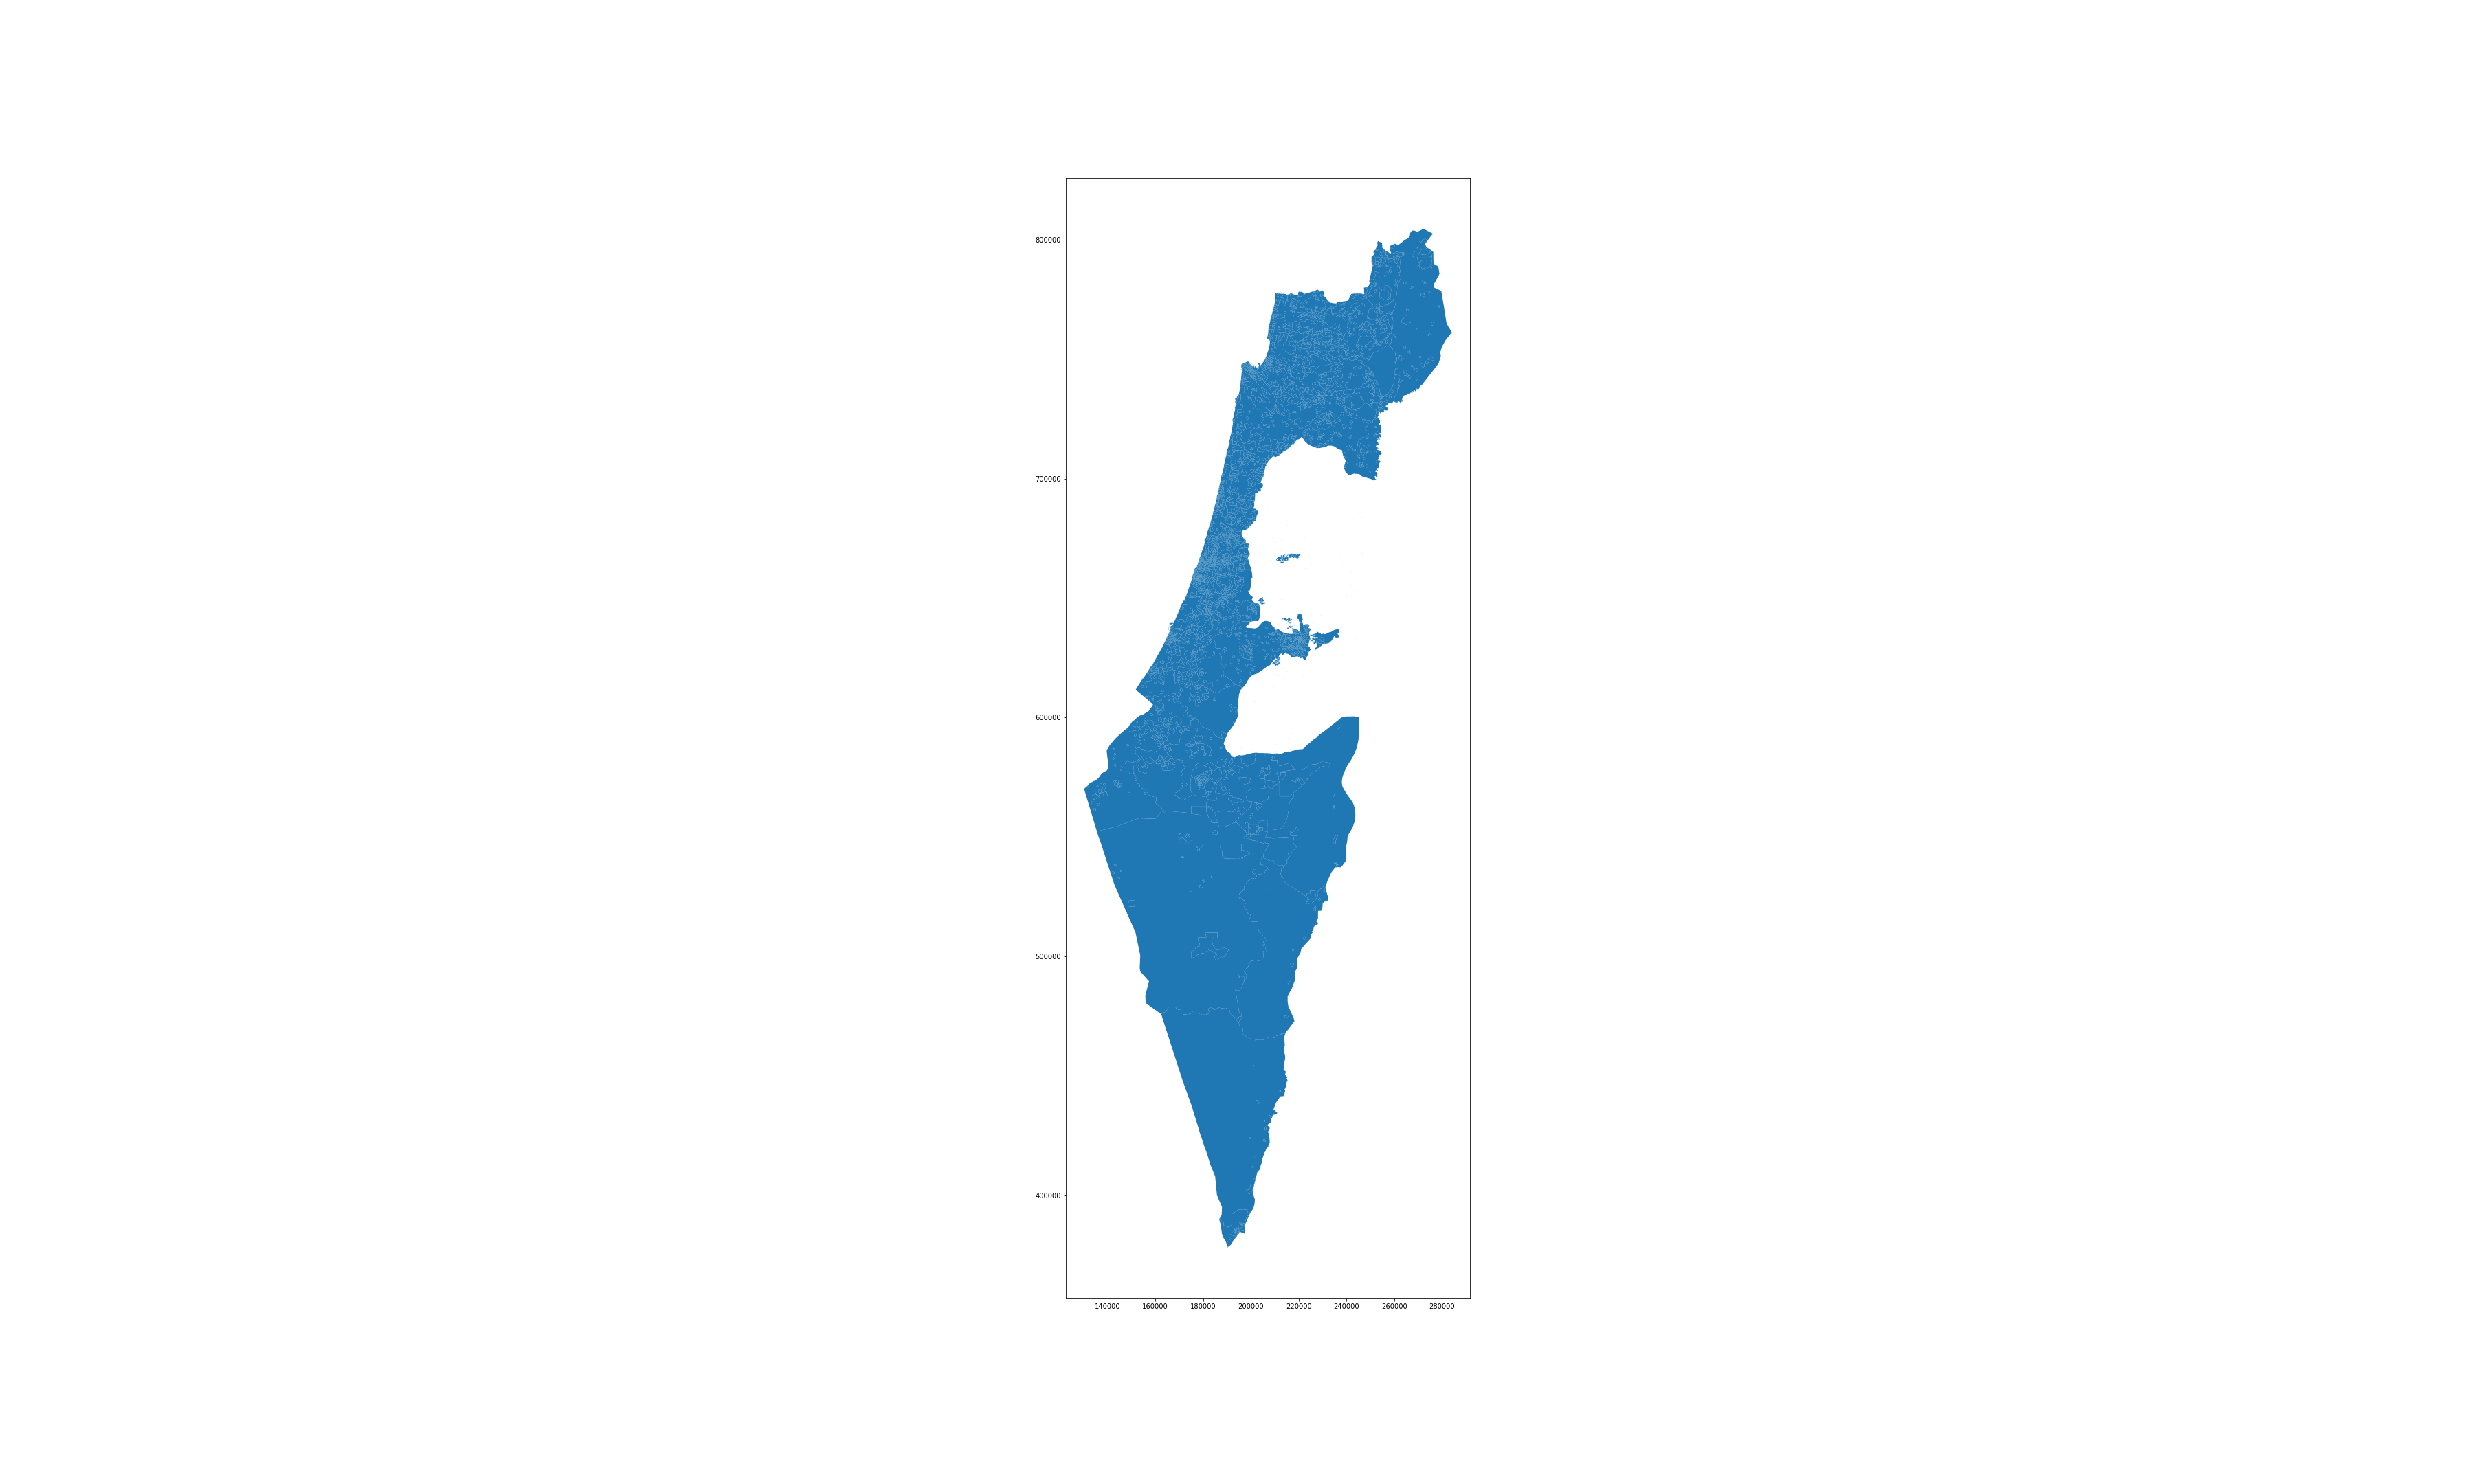
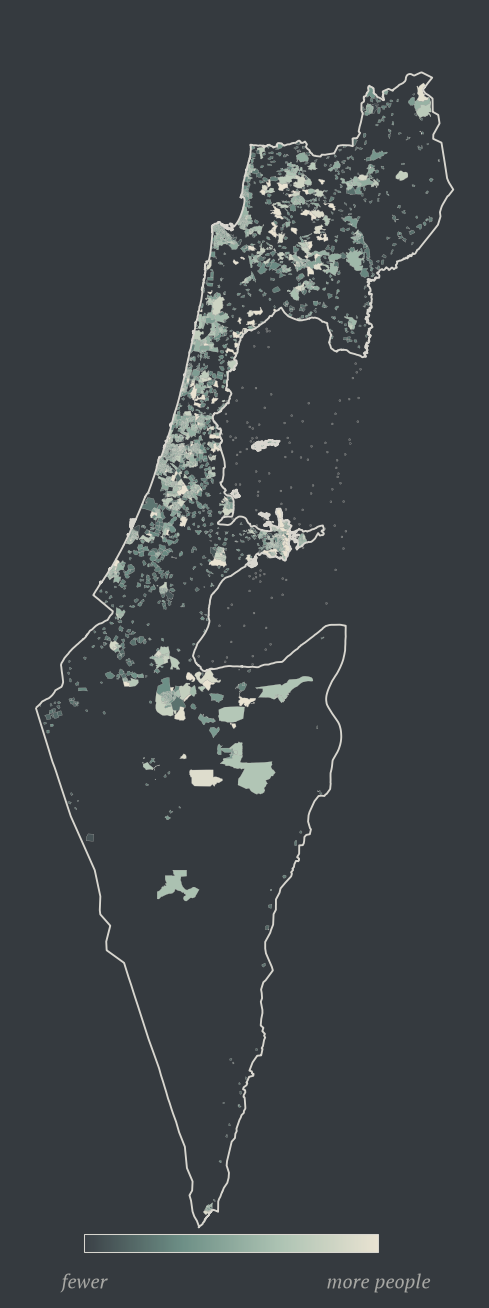
We plot the areas coloured by that population column, just to check we are onto something. The crowded coastal plain and the empty Negev stand out immediately (as do the missing West Bank and Gaza Strip). That unevenness is the whole reason the districting problem is interesting.
Polling place locations
The data from the Knesset website gives addresses (in Hebrew) for each polling place. We are going to use a geocoding API to get the latitude and longitude coordinates of each polling place. This will allow us to associate each polling place to a unique statistical area.
I first tried using Here for the geocoding API. It actually took some searching to find something that worked well in Hebrew, was decently accurate, free and not Google. I got what seemed like pretty decent results with this free API, with the geocoding succeeding 84% of the time. Note that’s still almost seven hundred addresses I would need to encode manually (or with a better API) however.
Then I looked at the data, and noticed much of it was completely wrong. At first I used just the address and town fields to build the address; with this I managed to tag 84% of the polling places. When I added the “location” field as well, I actually got worse results, I guess because I was confusing the API.
So in the end, with my tail between my legs, I signed up for Google Cloud Platform and used about 30 of my 300 USD credits doing the geocoding through the best geocoding API money can buy. You really cannot come close to Google and it’s a bit scary how good they are. I got 97.2% of the addresses coded, leaving me with only 122 to encode manually.
 1def geocode_polling_places(df, api_key):
 2    df["address"] = (df["מקום קלפי"] + ", "
 3                     + df["כתובת קלפי"].str.replace(",", " ") + ", "
 4                     + df["שם ישוב בחירות"])
 5    coords = {}
 6    for address in df["address"].unique():
 7        r = requests.get("https://maps.googleapis.com/maps/api/geocode/json",
 8                         params={"address": address, "key": api_key}).json()
 9        try:
10            loc = r["results"][0]["geometry"]["location"]
11            coords[address] = (loc["lat"], loc["lng"])
12        except (KeyError, IndexError):
13            coords[address] = (0, 0)
14        time.sleep(1)
15    df["geo_pts"] = df["address"].map(coords)
16    return df
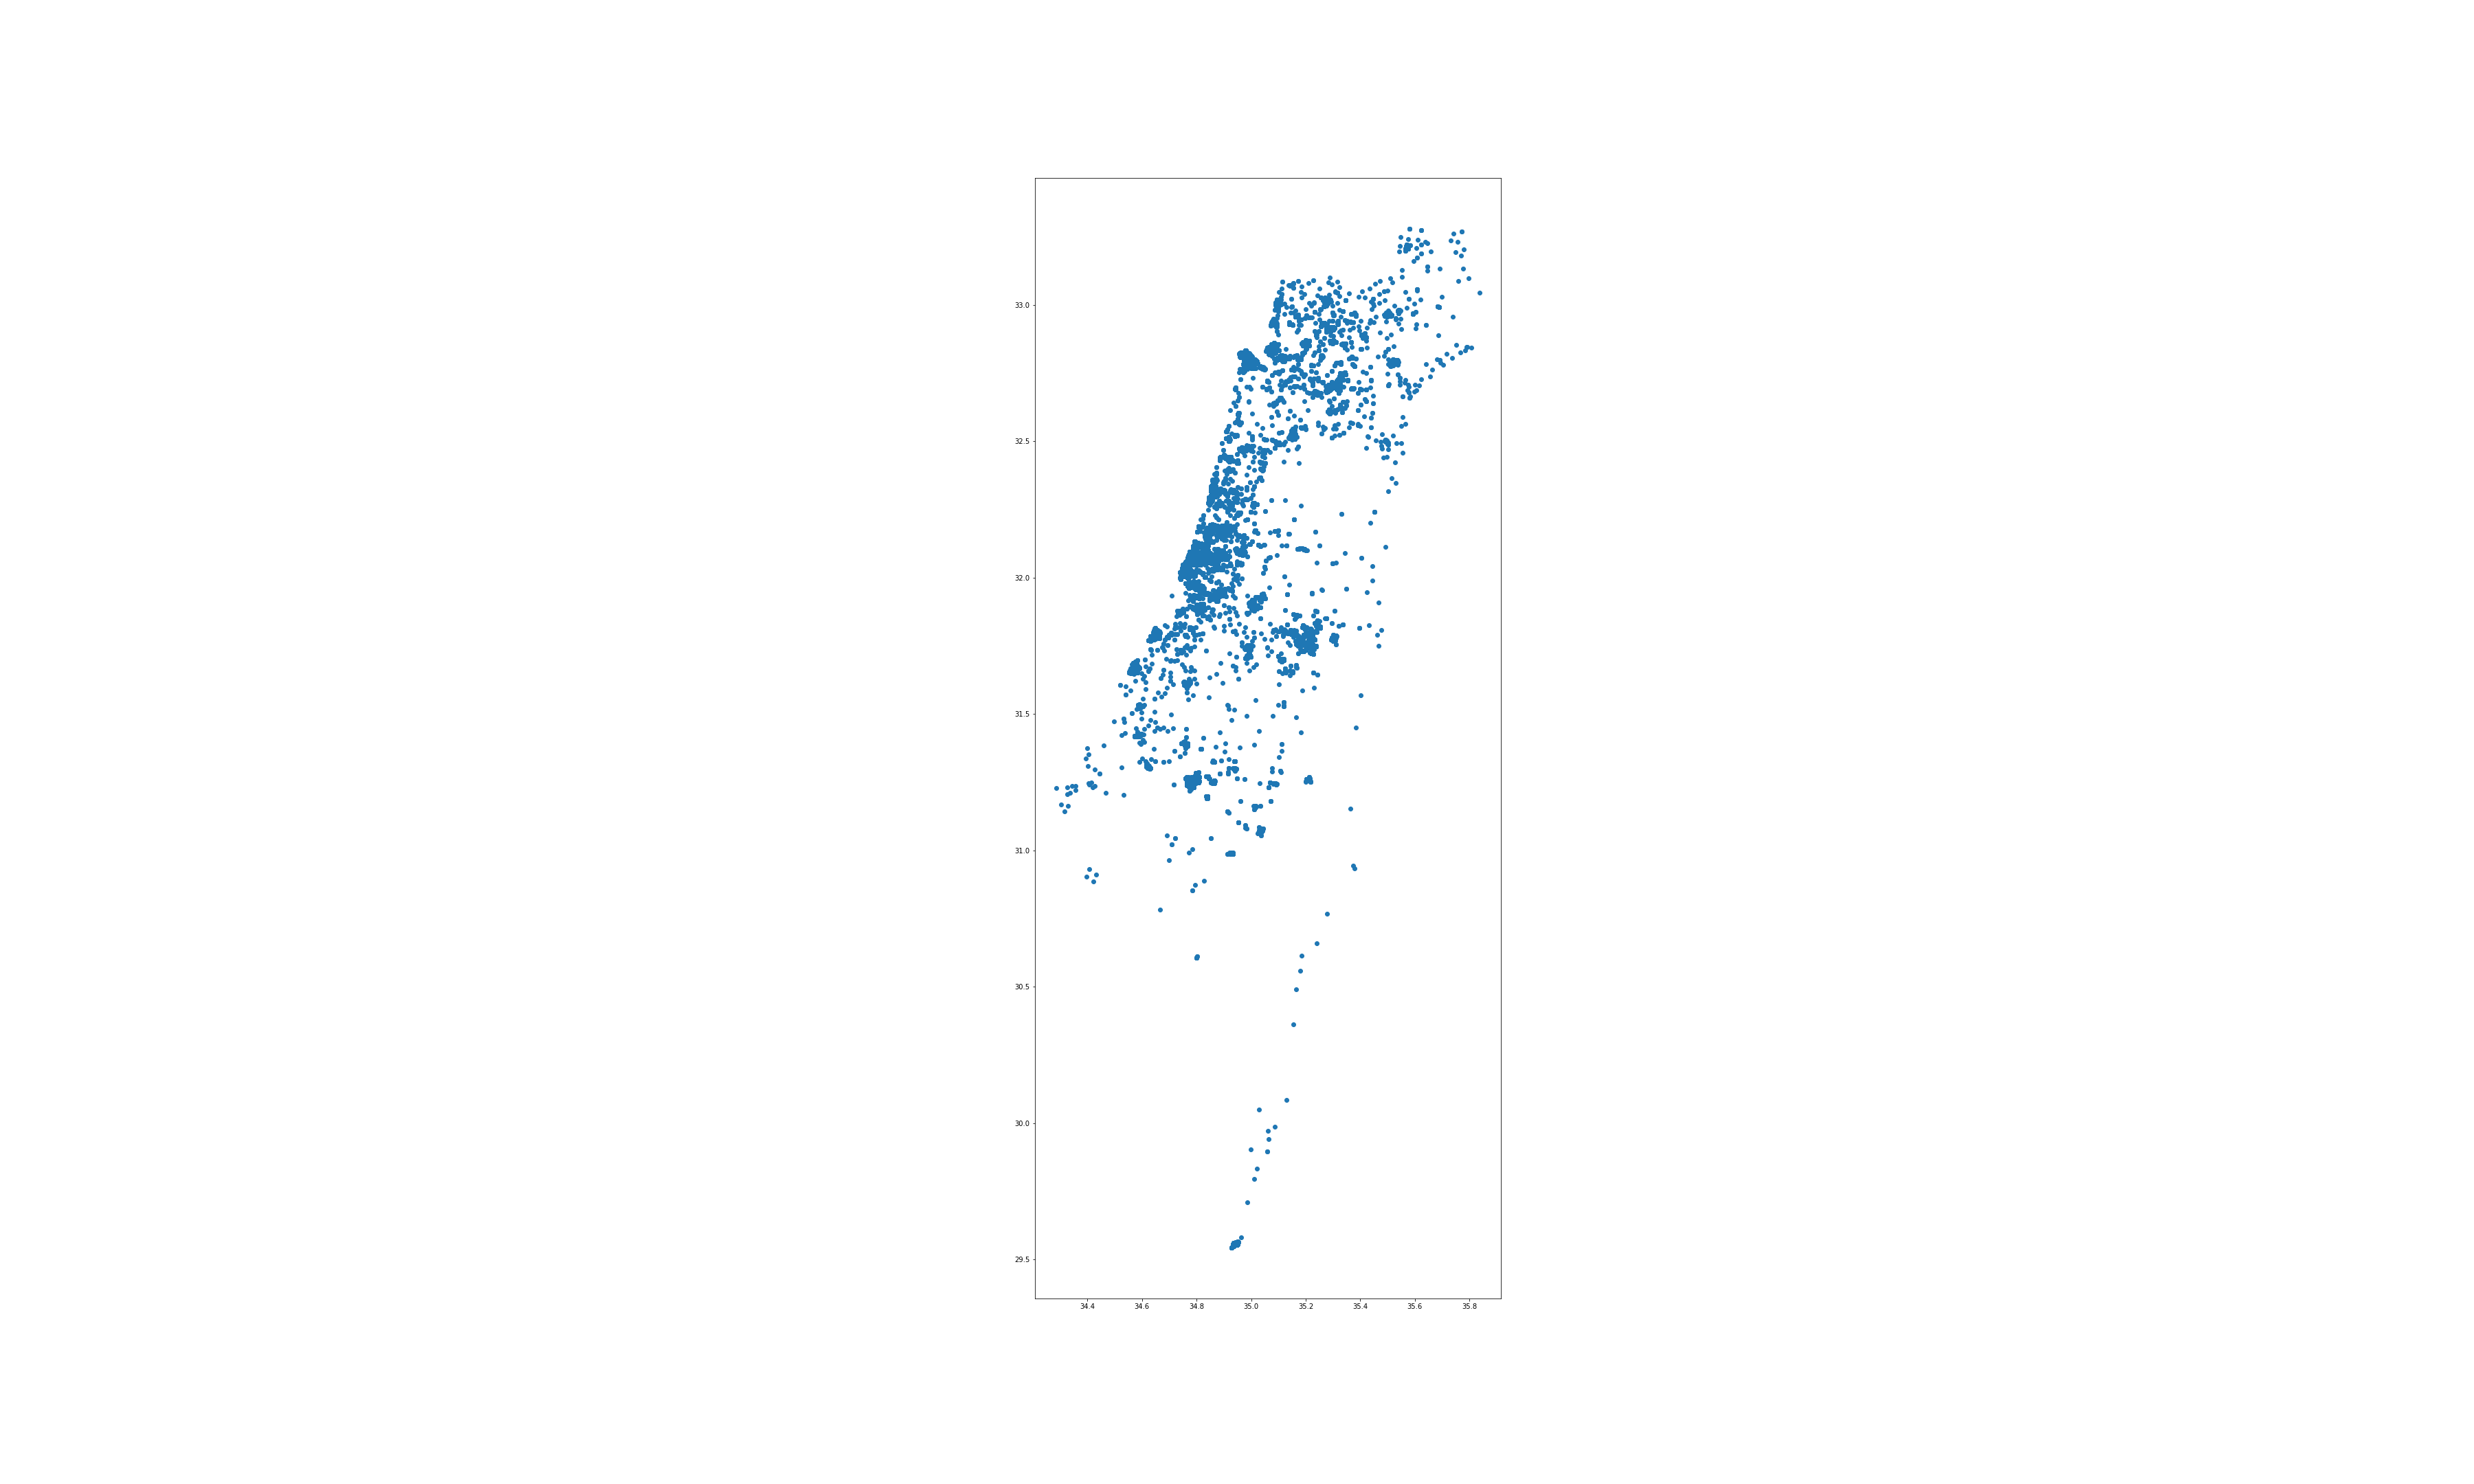
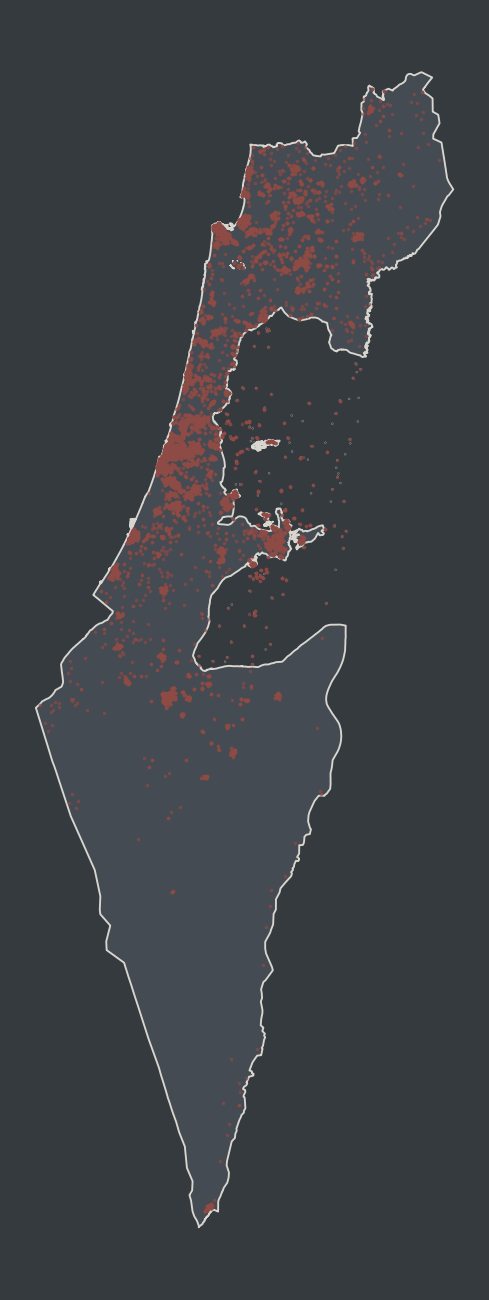
Let’s plot the points we got just to see everything looks right.
Get the statistical area for each polling place
Now for a spatial join. The statistical areas file comes in a special Israeli projection, so we first convert it to the usual WGS84 system before we can run the “within” test and ask, for each polling place, which area’s polygon it falls inside. About 97% of the boxes land cleanly inside an area. We actually expect a few to miss because there are polling places scattered all over the West Bank that clearly belong to no statistical area.
If we merge the votes onto those boxes, group by area, and take the largest party in each (i.e. “first past the post”), we get an initial, fairly unsatisfying answer to “who won where”:
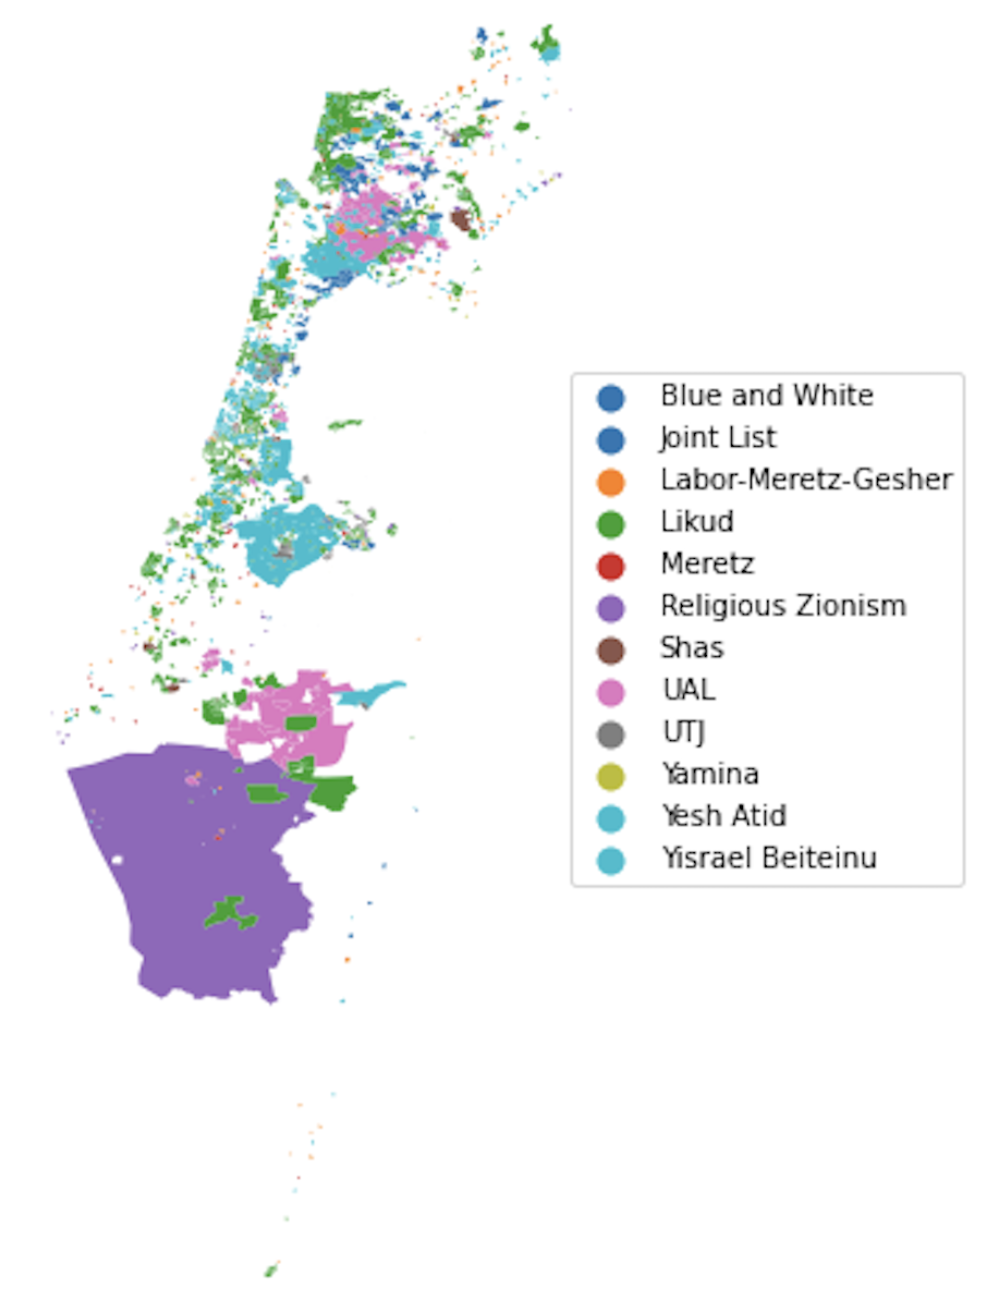
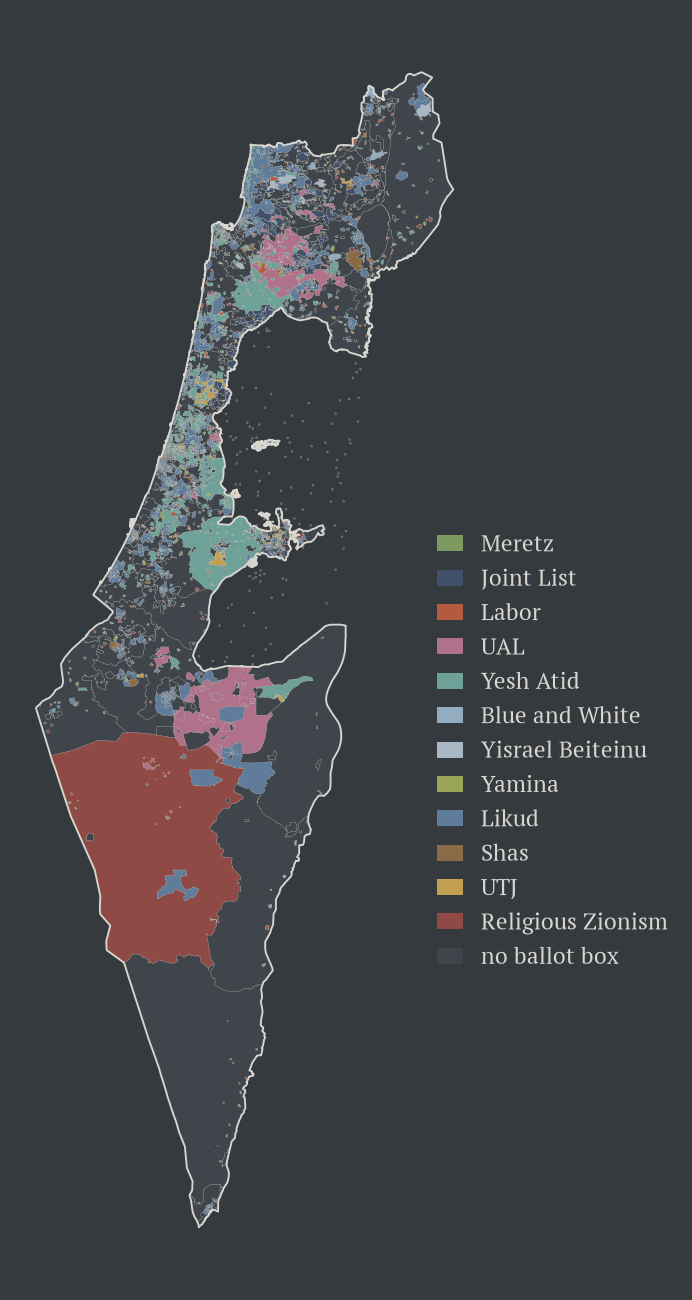
This map has a lot of holes because 955 of the 3,187 areas contain no polling place at all. They are presumably unsettled, farmland or empty hills — and, more fundamentally, statistical areas are not constituencies. They run from a few dozen residents to many thousands. To hold an election you have to bundle them into 120 chunks of equal population. That bundling is the real problem, and it is a surprisingly deep one.
Clustering areas into constituencies
Our next task is to create 120 electorates of roughly equal population by combining statistical areas together. I hadn’t really thought about it before I started, but as soon as I began working out how to actually do it, and reading around online, I realised this is exactly how real electoral districts are drawn in the countries that have them, and that there is quite a large body of research on this interesting and difficult problem. I read a good number of the papers, and decided to implement one of them: the balanced centroidal power diagram of Cohen-Addad, Klein and Young.
The idea is a capacitated variant of Lloyd’s algorithm (the thing behind k-means and Voronoi plots). We start with 120 randomly chosen centres, and repeat two steps until nothing moves:
- Given the centres, compute a balanced assignment of the population to them (minimum total squared distance, subject to every centre getting an equal share).
- Move each centre to the population-weighted centroid of the residents assigned to it.
The magic is in step 1. A plain nearest-centre assignment would leave the districts wildly unequal; the balance constraint is what makes them fair. My first instinct was to write that assignment as an integer program in Python-MIP, and I spent a good while stuck on it, until I reread the paper and realised the whole point of its first phase is that you allow the people in a census block to be split across districts. Once you accept that, the balanced assignment is no longer a nasty combinatorial problem at all: it is exactly a minimum-cost flow. Make each area a source with supply equal to its population, each centre a sink demanding an equal quota, put the squared distance on every arc, and OR-tools solves it in a few seconds.
1from ortools.graph.python import min_cost_flow
2
3smcf = min_cost_flow.SimpleMinCostFlow()
4# area i -> centre j, capacity = area population, cost = squared distance
5smcf.add_arcs_with_capacity_and_unit_cost(area_nodes, centre_nodes, caps, costs)
6smcf.set_nodes_supplies(area_nodes, populations)      # sources
7smcf.set_nodes_supplies(centre_nodes, -quotas)        # sinks, equal demand
8smcf.solve()
After a bunch of iterations, we get 120 constituencies whose populations sit within about 1.4× of each other, which is respectable given that the raw building blocks vary by orders of magnitude: actually better than the 1.9x difference between Australia’s most (Blair) and least (Clark) populated electorates.
The West Bank
Remember that the census layer leaves out most of the West Bank settlements. This means that about 89,000 votes had been falling straight through the floor of everything we had built so far. And they are not random votes: they go overwhelmingly to right-wing parties Religious Zionism, Yamina and Likud.
The settlements have no polygon, but they do have ballot boxes, and each box comes with a location and a count of registered voters. So I made each settlement its own little districting unit, guessed its population from that voter count, and threw it into the clustering with everything else. It turns out the settler vote is concentrated enough to win seats on its own — a couple of the constituencies that fall out are won by Religious Zionism.
Connectedness
There is one thing the power diagram knows nothing about, and it is a big one: connectedness. Nothing in the algorithm says a constituency has to be joined up, so it will cheerfully hand a slice of one city to a district on the far side of a ridge if that helps even out the populations. The result is electorates in scattered, disconnected pieces. And the annoying thing is that the two goals really do fight each other: you can have equal populations or tidy connected shapes, but push hard on one and you wreck the other. (When I tried forcing perfect contiguity by brute force, the range between smallest and largest blew out to 8x).
I got most of the way there with two ideas. First, a lot of the “enclaves” turned out to be an artefact of the data rather than the algorithm: about 120 statistical areas don’t actually touch any neighbour at all — a kibbutz sitting across a road, a settlement in a strip of land nobody counted — so I just bridged each of those to its nearest neighbours and let it be swallowed by whatever surrounds it. Second, a fiddlier balance-preserving local search that shuffles boundary areas between neighbouring districts, only ever accepting a swap when both districts stay within a population tolerance. Between them they take the map from a speckle of some 600 fragments down to roughly 120 clean shapes, at almost no cost to the balance. A stubborn few enclaves survive — the ones that are there precisely because the populations have to come out equal — and I have made my peace with them.
And so, at last, we have a map: 120 equal-population constituencies covering the whole country. Now we can finally do the thing this was all for, and hold the election.
Results
Obviously, the parliament you get out of the map depends entirely on the rule you use to turn votes into seats.
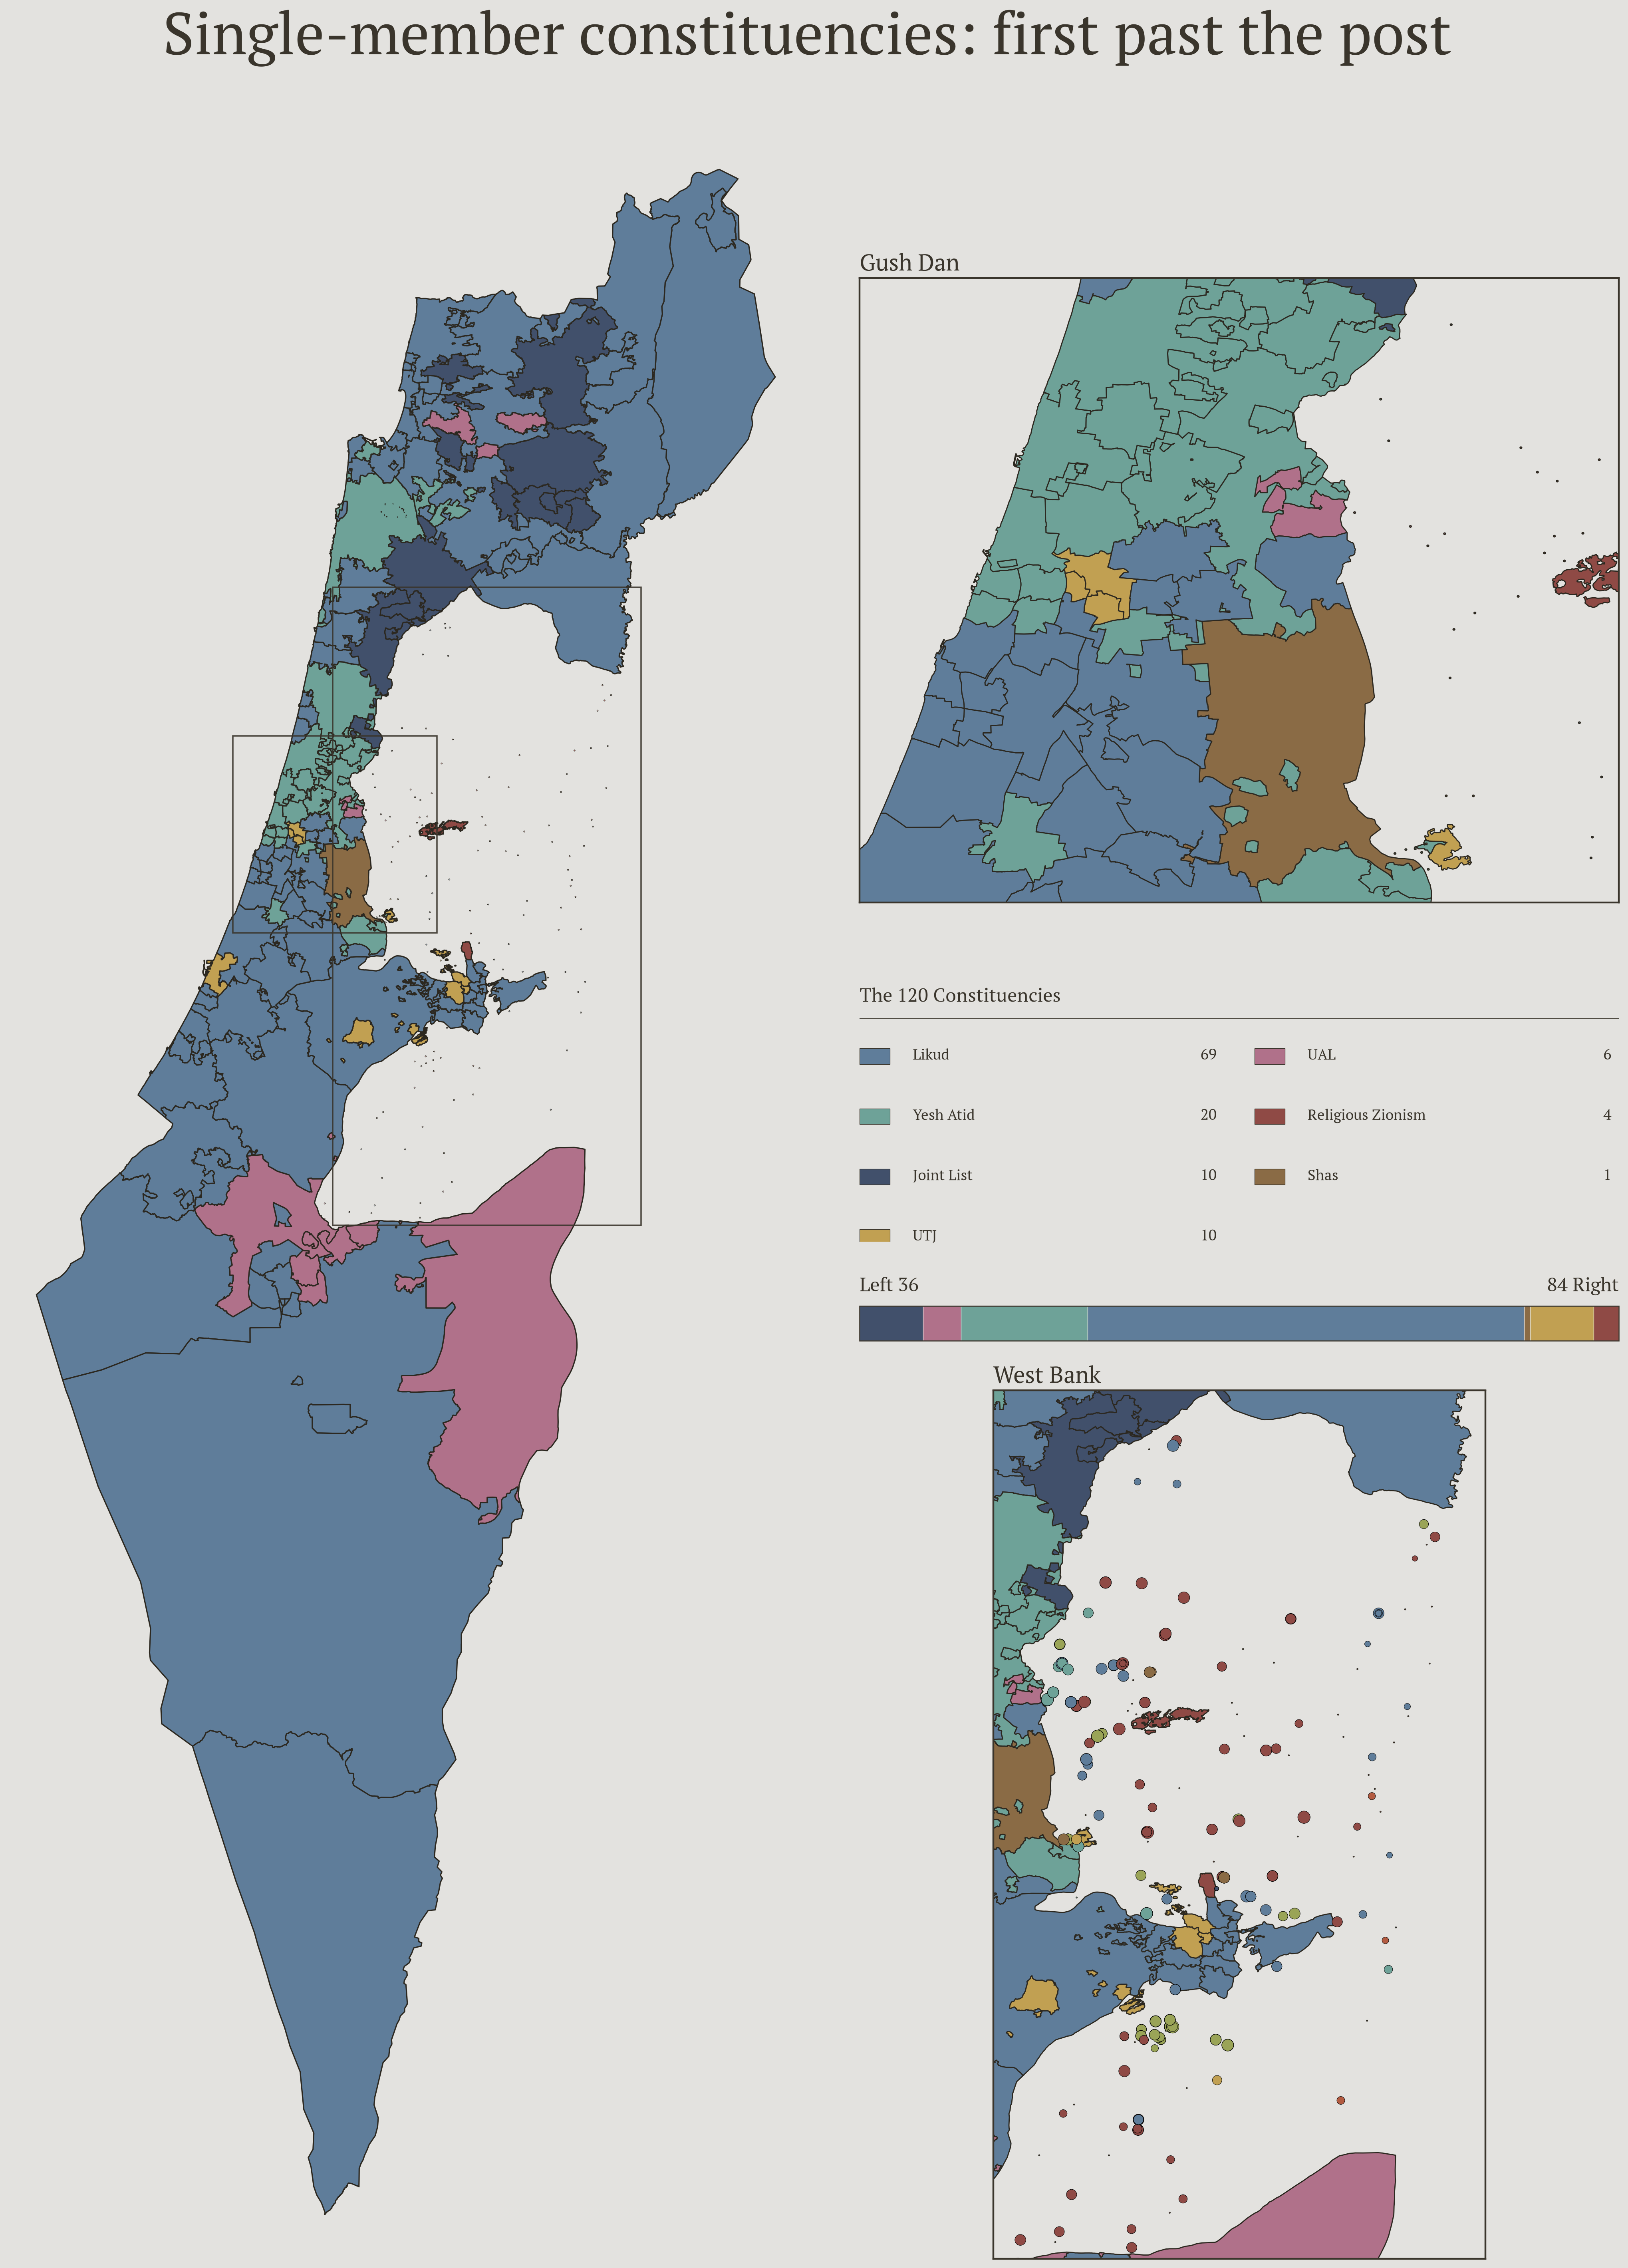
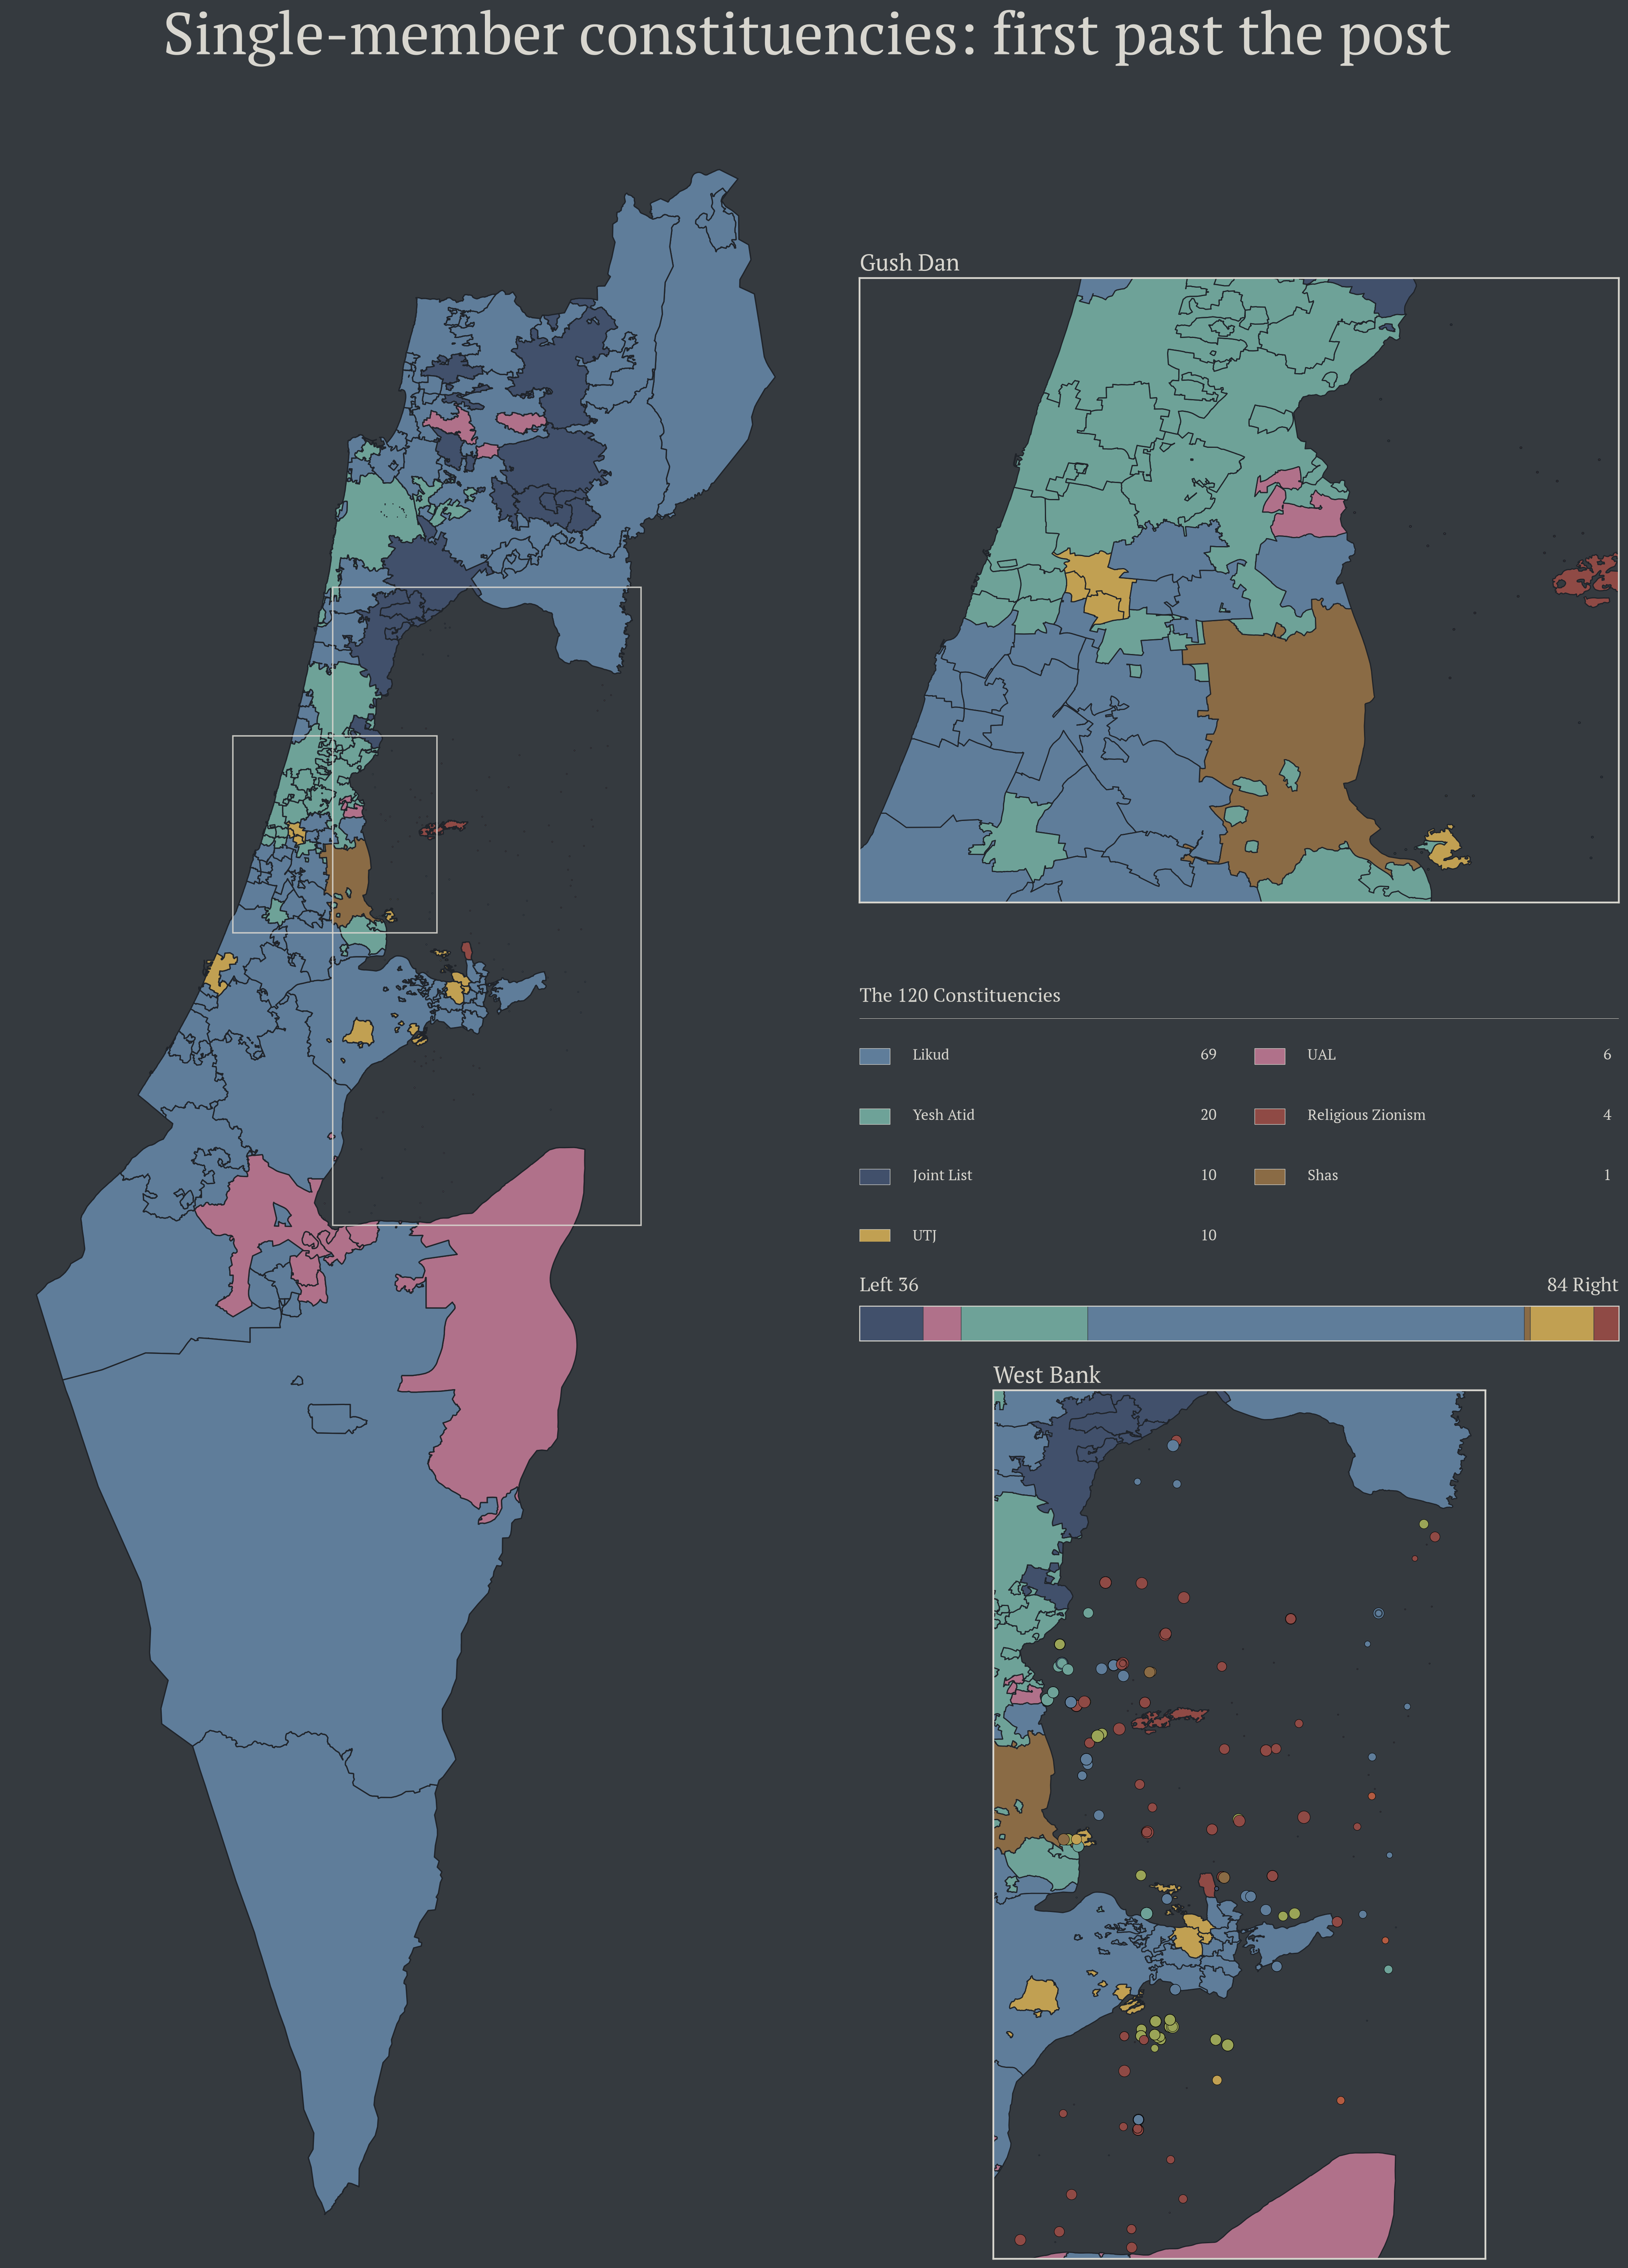
First, the British way: in each seat, whoever gets the most votes wins it (first past the post). Do that across all 120 constituencies and you get a landslide that never actually happened:
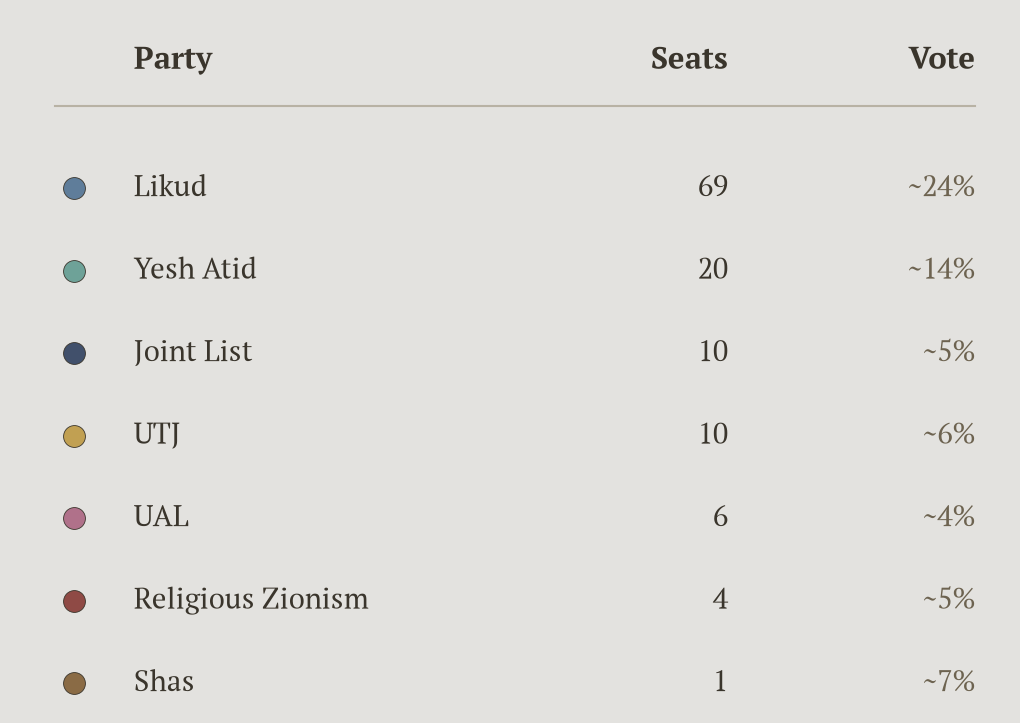
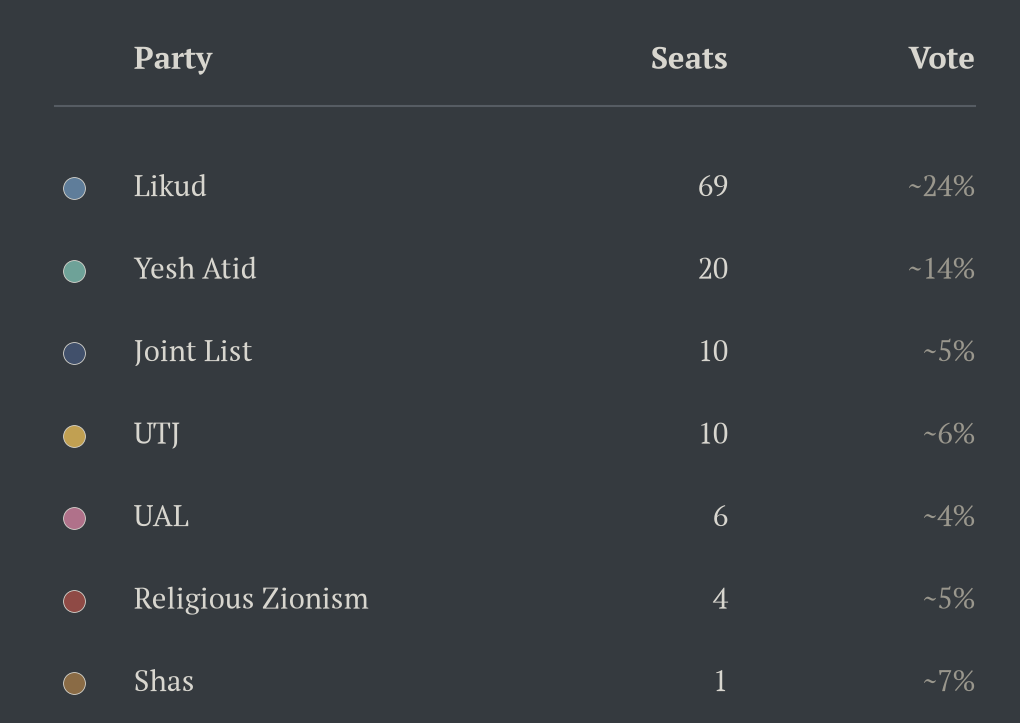
Likud ends up with 69 of the 120 seats — on under a quarter of the national vote. This is first-past-the-post doing exactly what it is famous for: the biggest party wins seat after seat on a plurality, because the opposition is split eleven ways and a different party keeps coming second. The blocs come out 36 to the left and 84 to the right: an enormous majority conjured out of what was, nationally, very nearly a dead heat.
A lot of that distortion is really just vote-splitting, and there is a well-known cure for it: the Australian system, called instant-runoff voting (IRV, or in the 2011 UK referendum, “Alternative vote”). Instead of picking one candidate, voters rank them (either all of them or some of them) according to their preference. You count everyone’s first choice; if nobody has a majority you knock out the weakest candidate, hand their ballots on to whoever those voters put next, and count again, repeating until someone finally clears 50%.
The obvious problem is that I don’t have any ranked ballots to perform these instant runoffs. So inspired by my UK AV sim post, I guessed preference flows based on the actual bloc structure of 2021: the pro-Netanyahu right and religious parties (Likud, Religious Zionism, Shas, UTJ) preferencing each other; the “anti-Bibi” change bloc (Yesh Atid, Blue and White, Labor, Meretz, Yisrael Beiteinu, New Hope) doing the same among themselves; and the two Arab parties, Joint List and UAL, preferencing each other and then flowing leftward. So an eliminated Shas ballot flows to UTJ, then Likud, then Religious Zionism; a Meretz ballot flows to Labor, then Yesh Atid; a Joint List ballot to UAL and then leftward. Then I run the real runoff in code, one constituency at a time: tally the ballots at their top surviving preference, drop the weakest party, redistribute, and repeat until someone has a majority.
 1def irv_winner(votes, rankings):
 2    eliminated = set()
 3    while True:
 4        tally = Counter()
 5        for party, n in votes.items():                 # every ballot flows to its
 6            choice = next(c for c in rankings[party]    # top *surviving* preference
 7                          if c not in eliminated)
 8            tally[choice] += n
 9        leader, best = tally.most_common(1)[0]
10        if best * 2 > sum(tally.values()):              # a majority? that's the winner
11            return leader
12        eliminated.add(min(tally, key=tally.get))       # otherwise cut the weakest
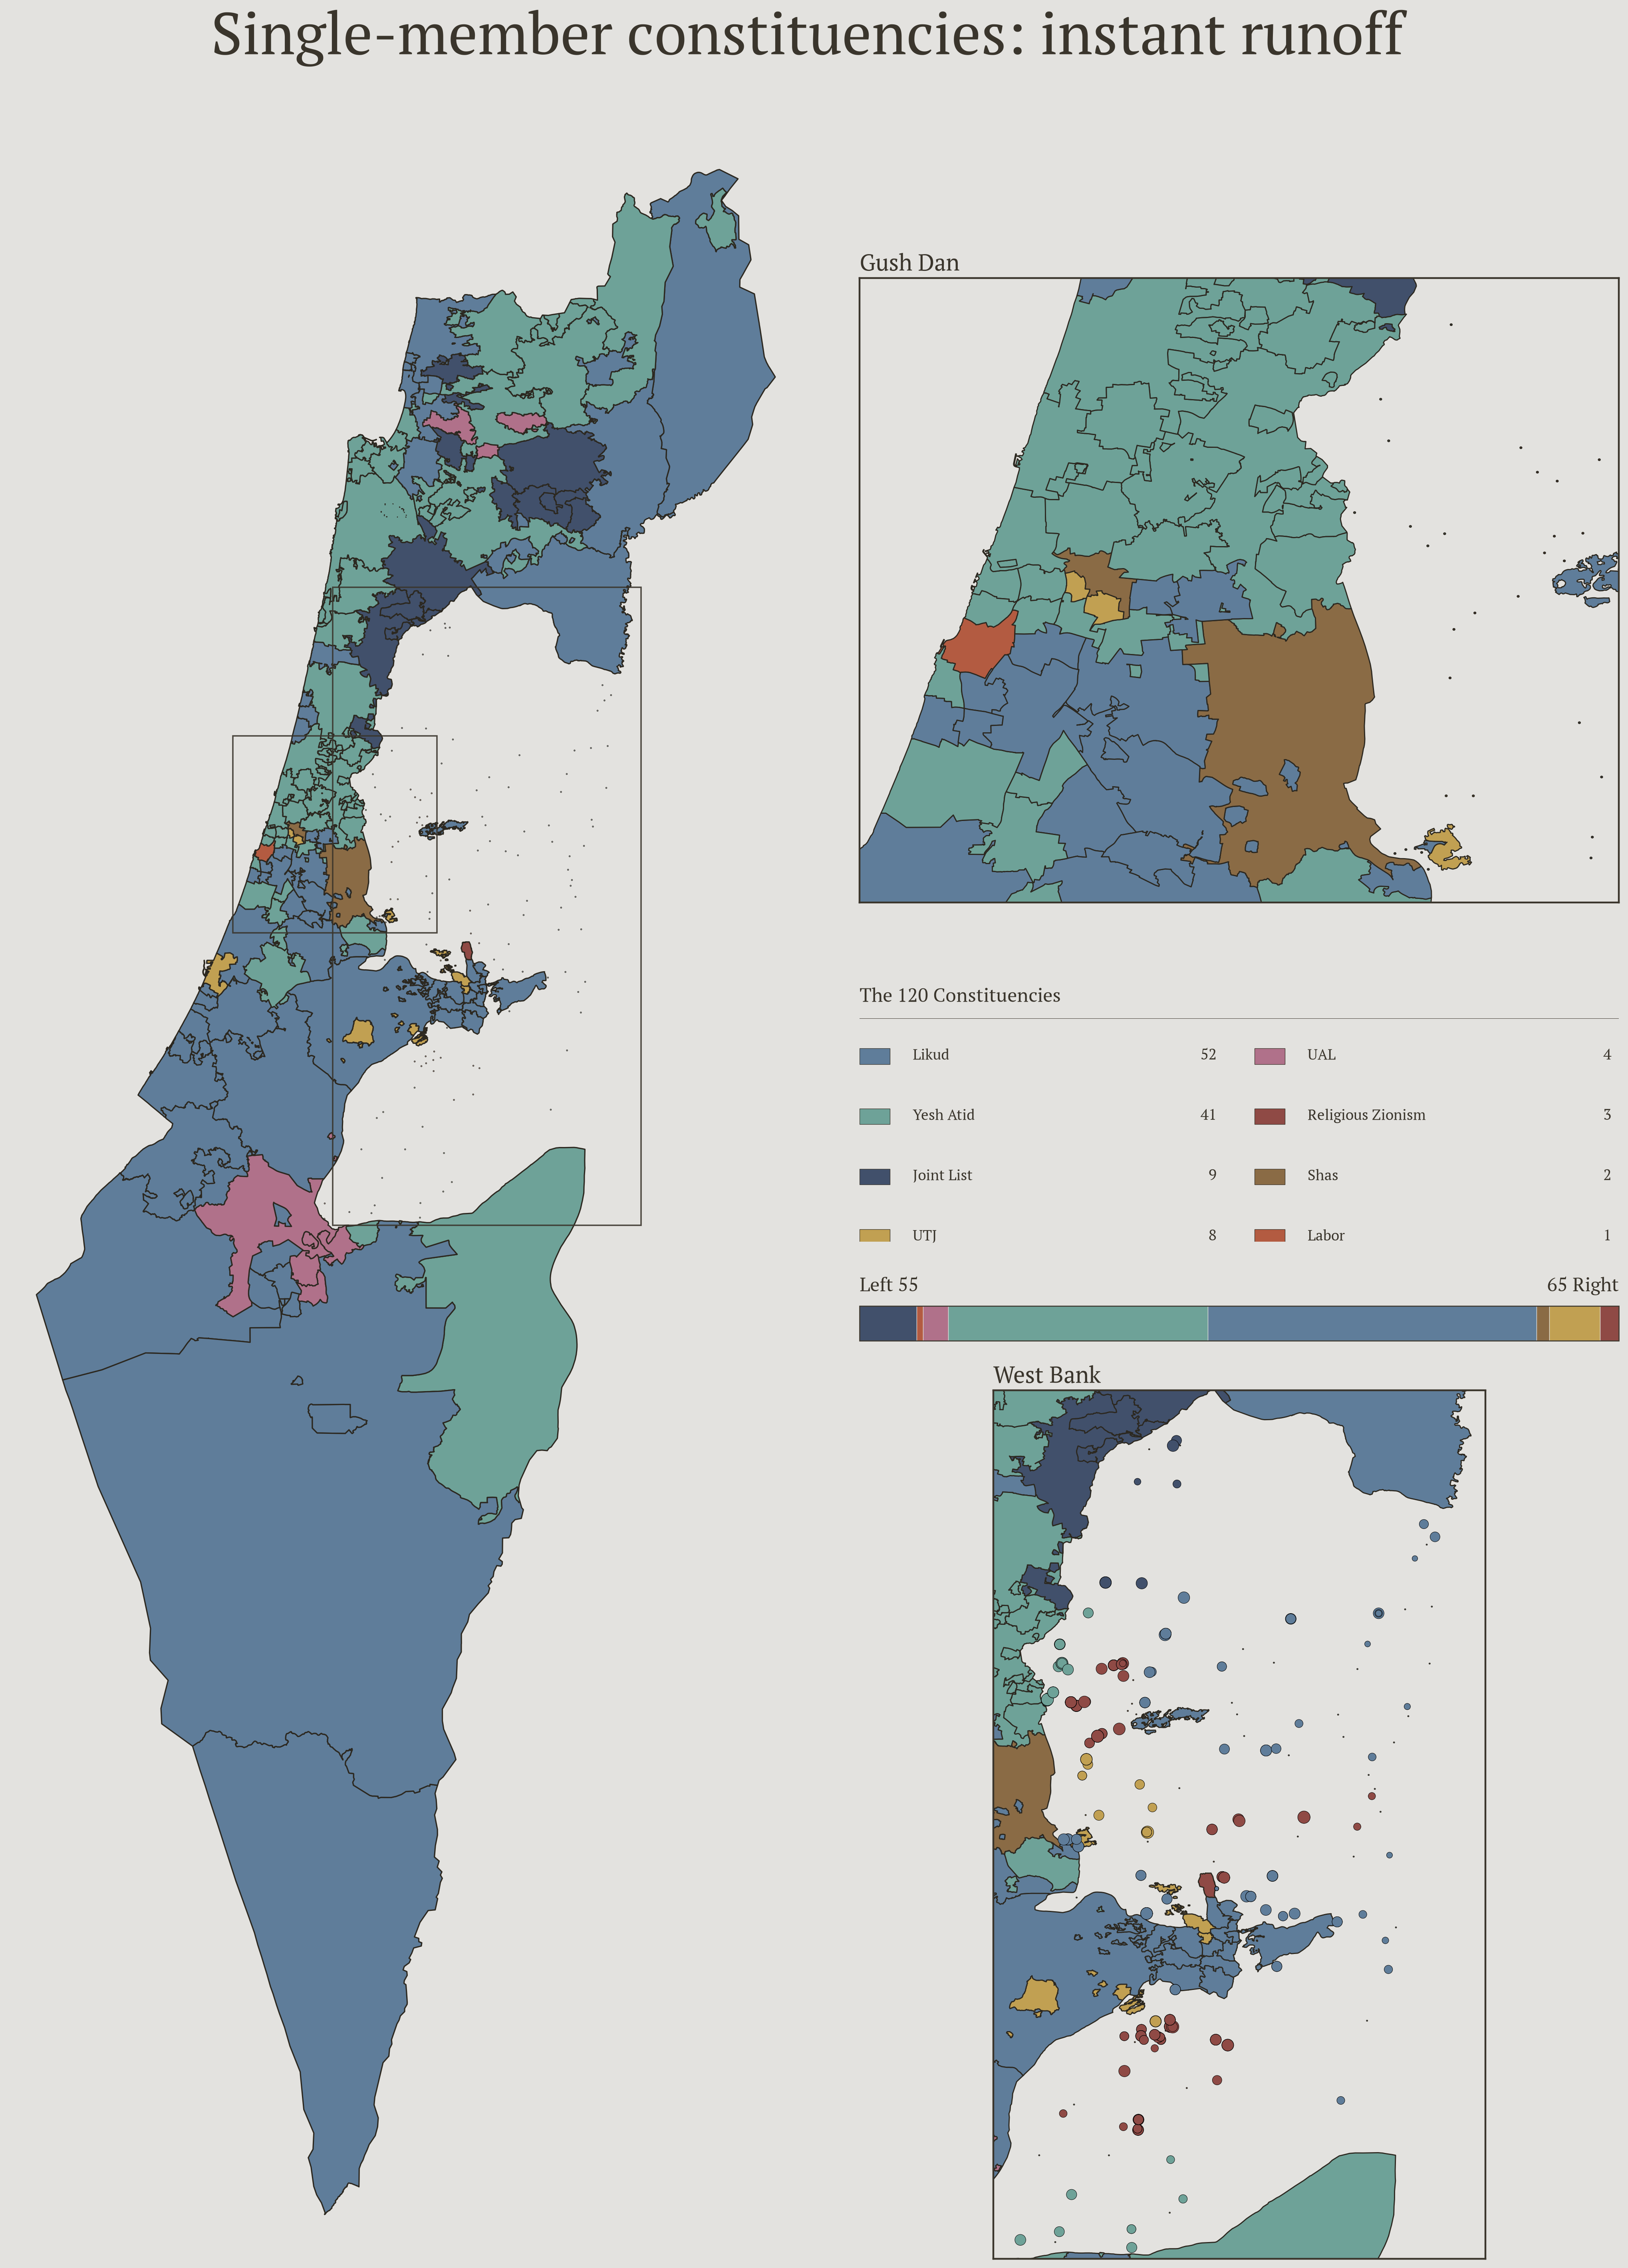
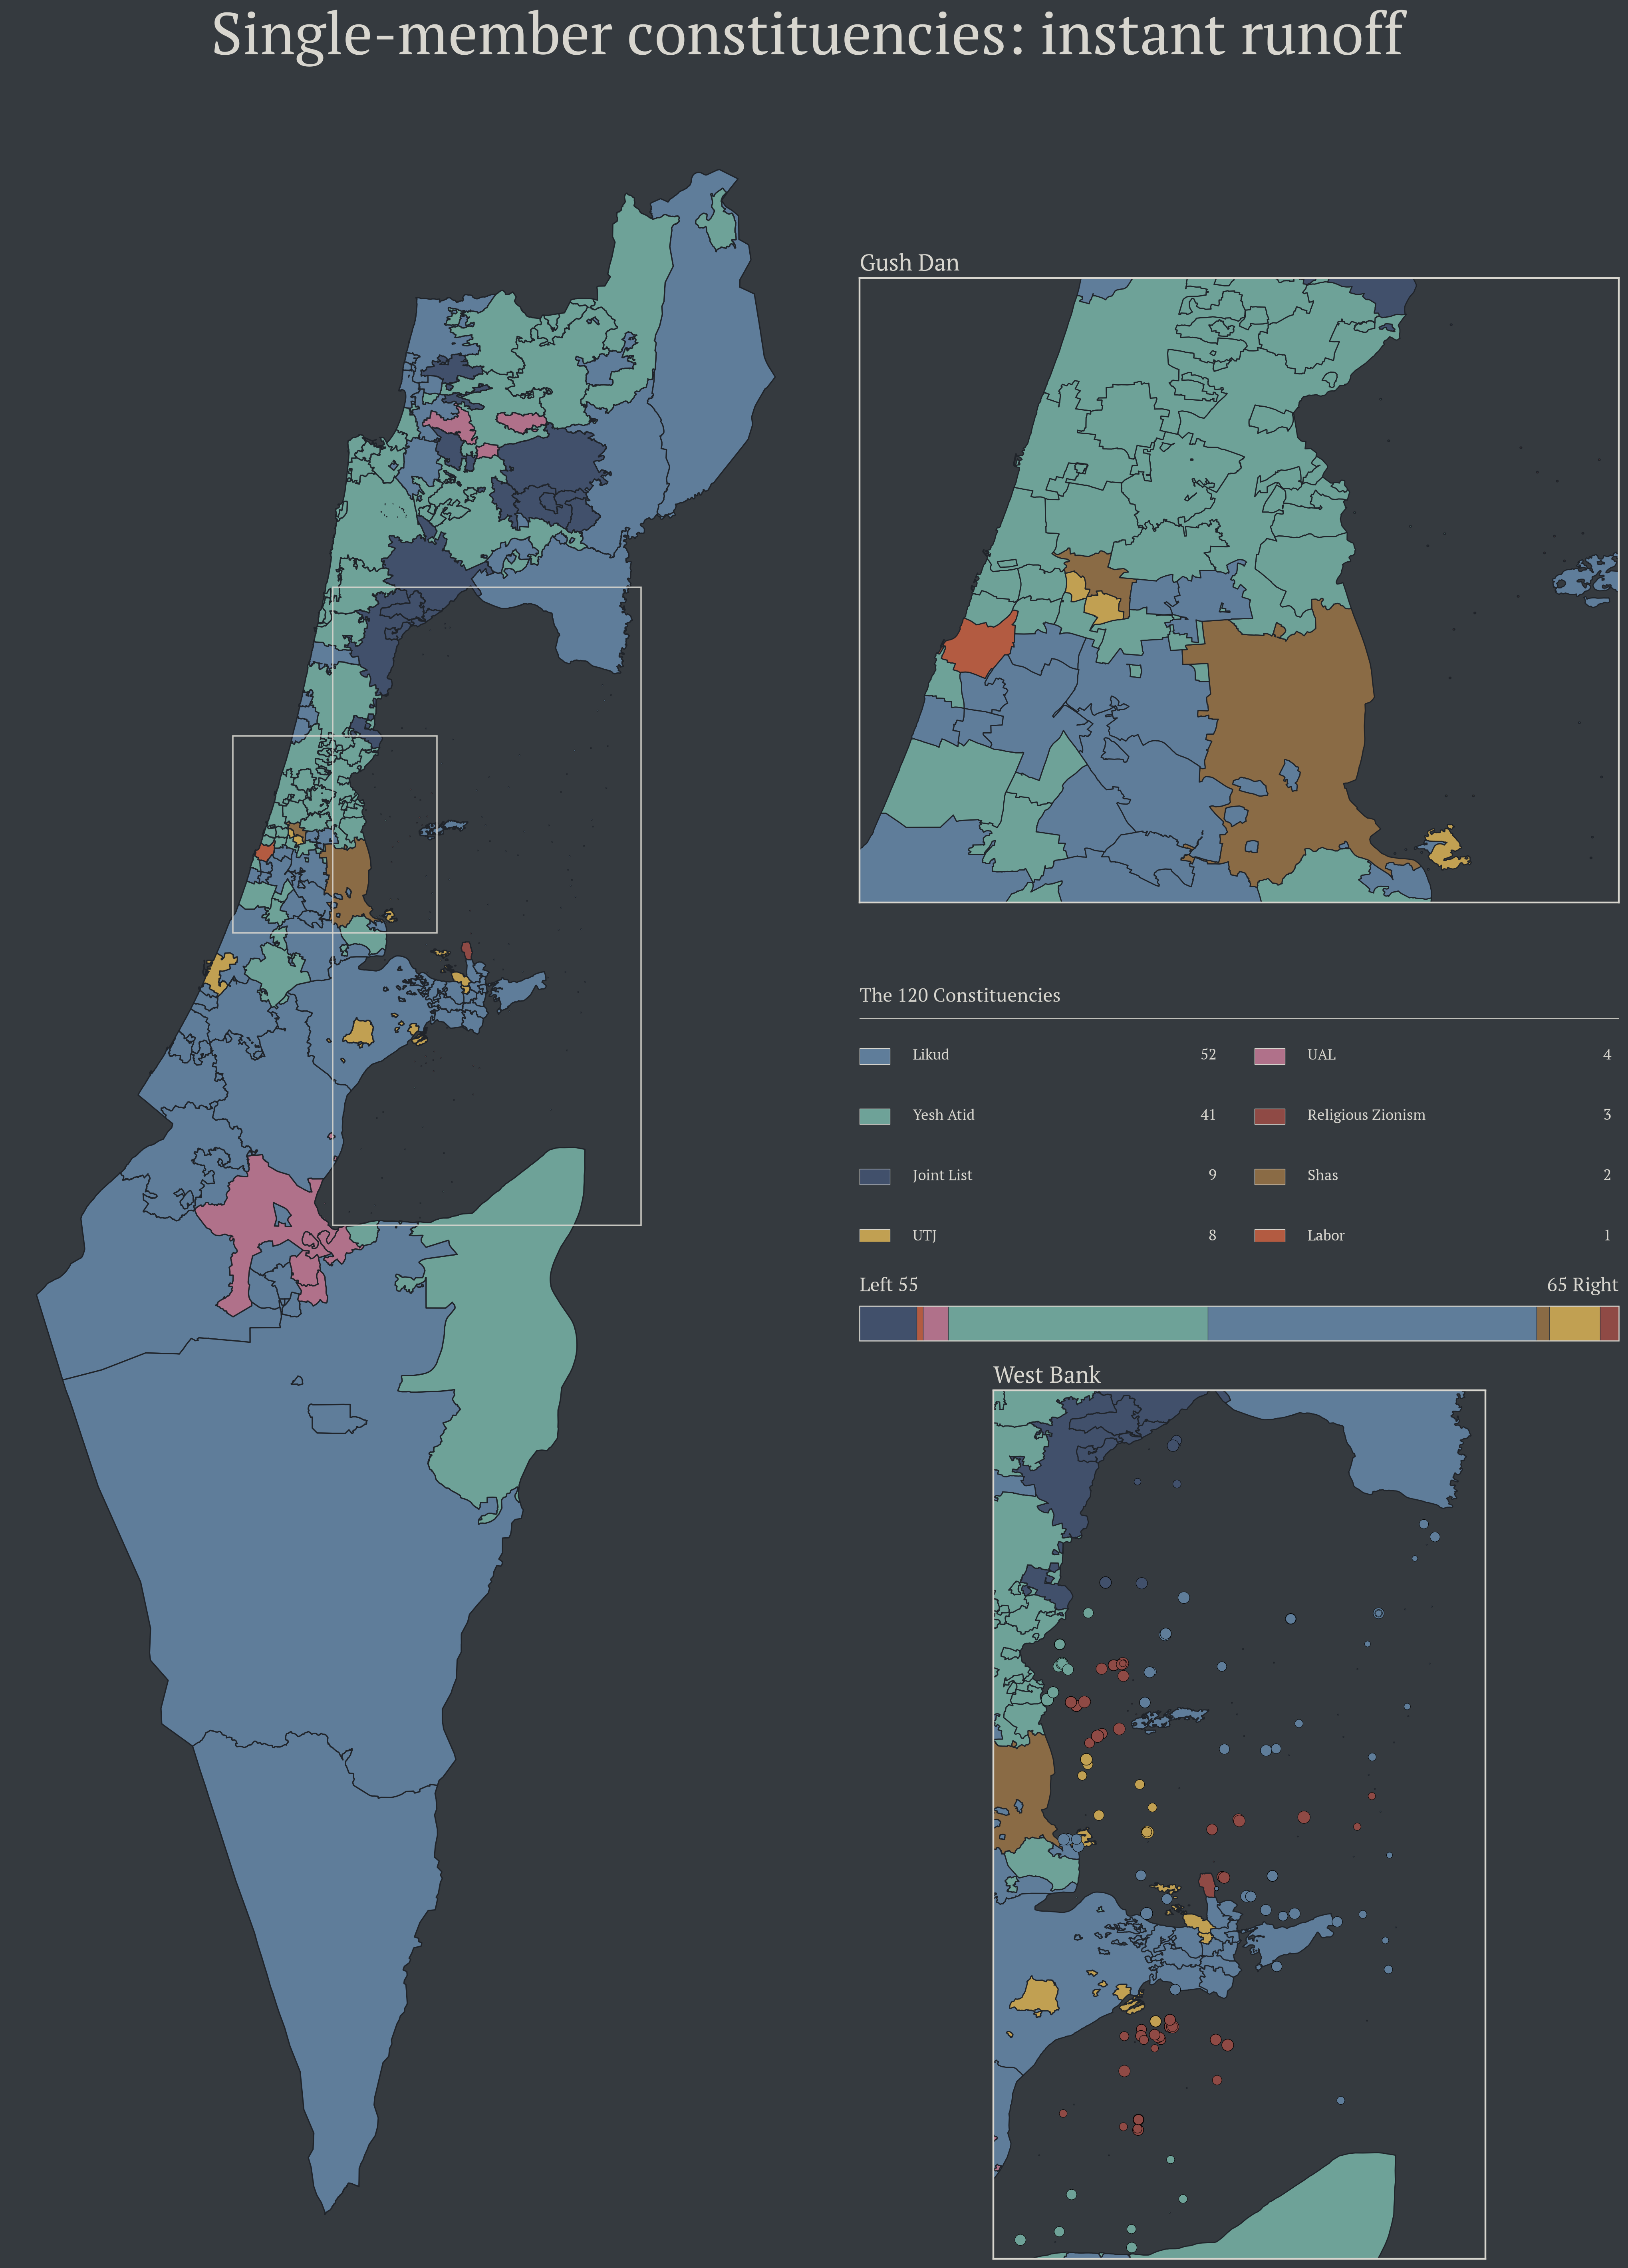
Under IRV, the splintered centre suddenly gathers behind Yesh Atid, which jumps from 20 seats to 41:
- Likud 52, Yesh Atid 41, Joint List 9, UTJ 8, UAL 4, Religious Zionism 3, Shas 2, Labor 1.
- Left bloc 55, right bloc 65 — and 27 of the 120 seats change hands compared to first-past-the-post.
That is a completely different parliament to FPTP, and much closer to the actual near-deadlock we got in 2021.
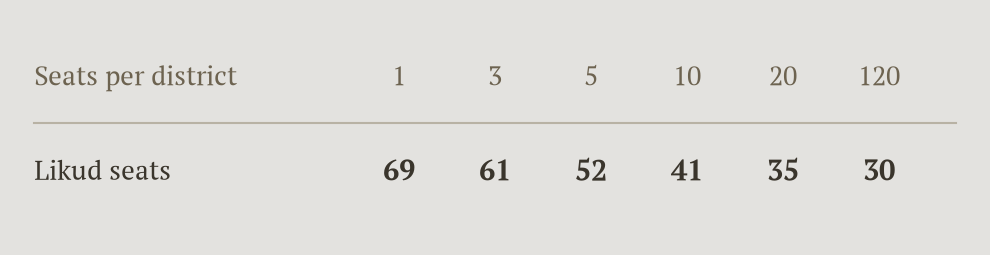
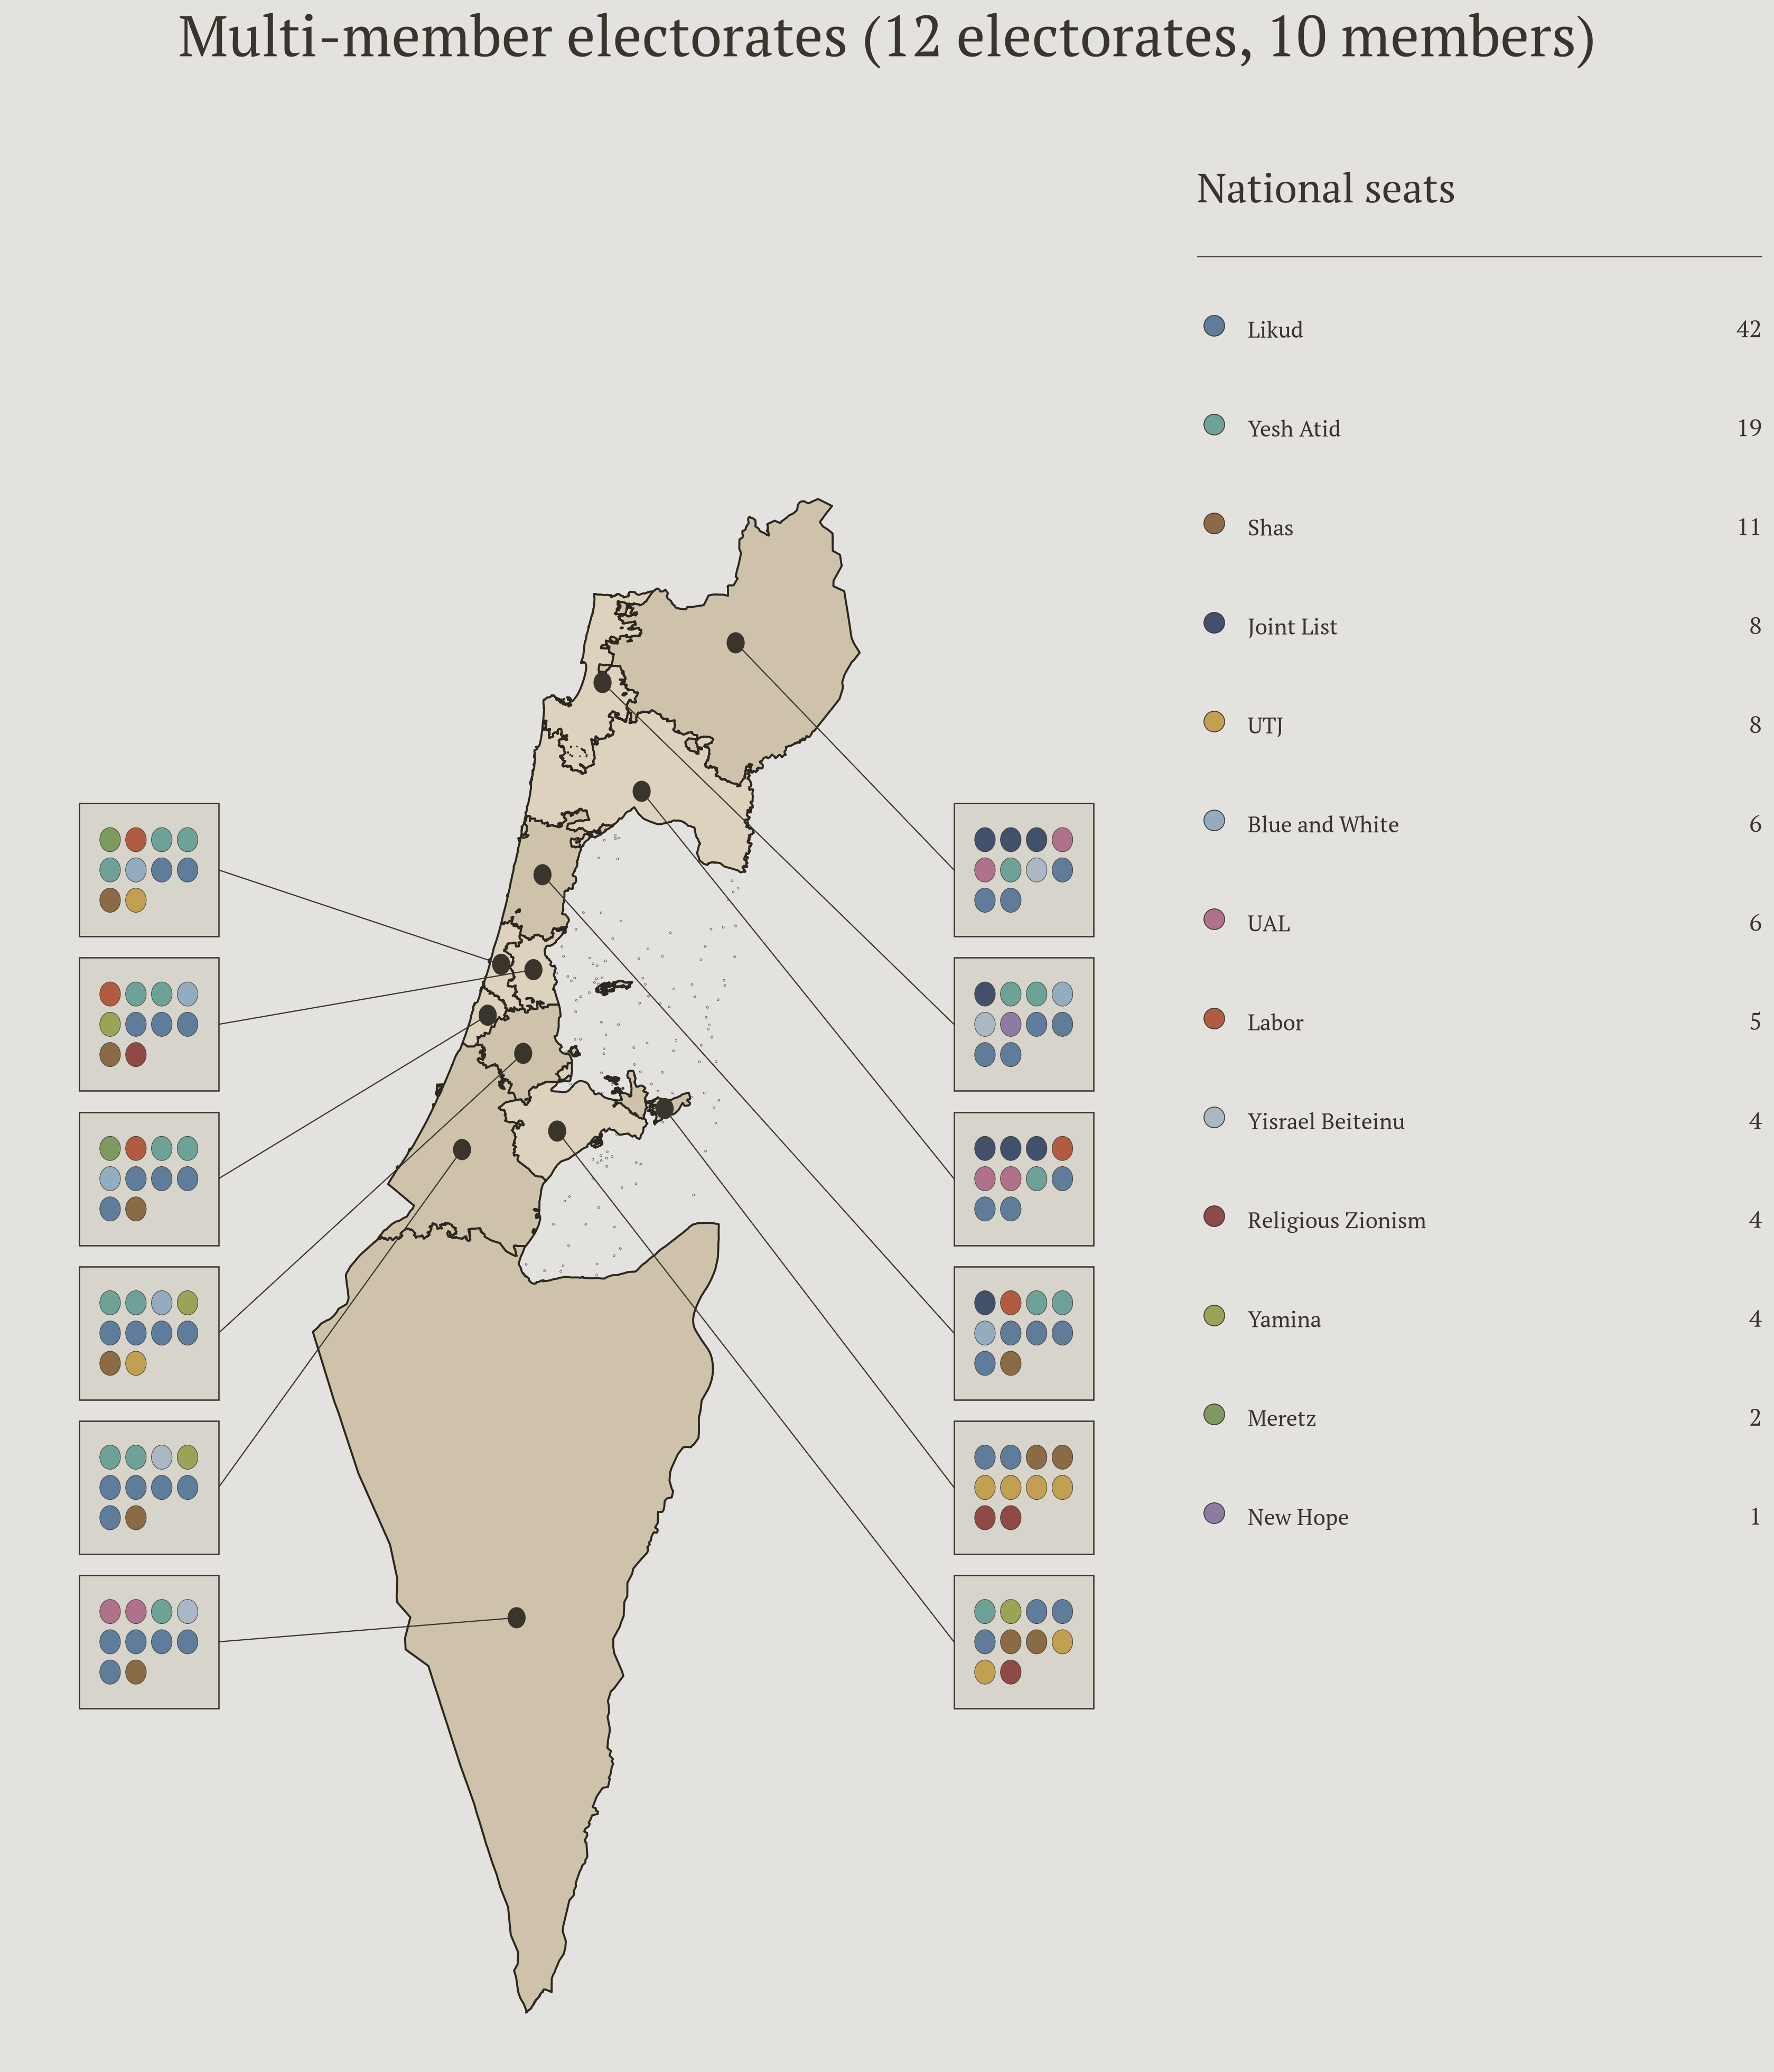
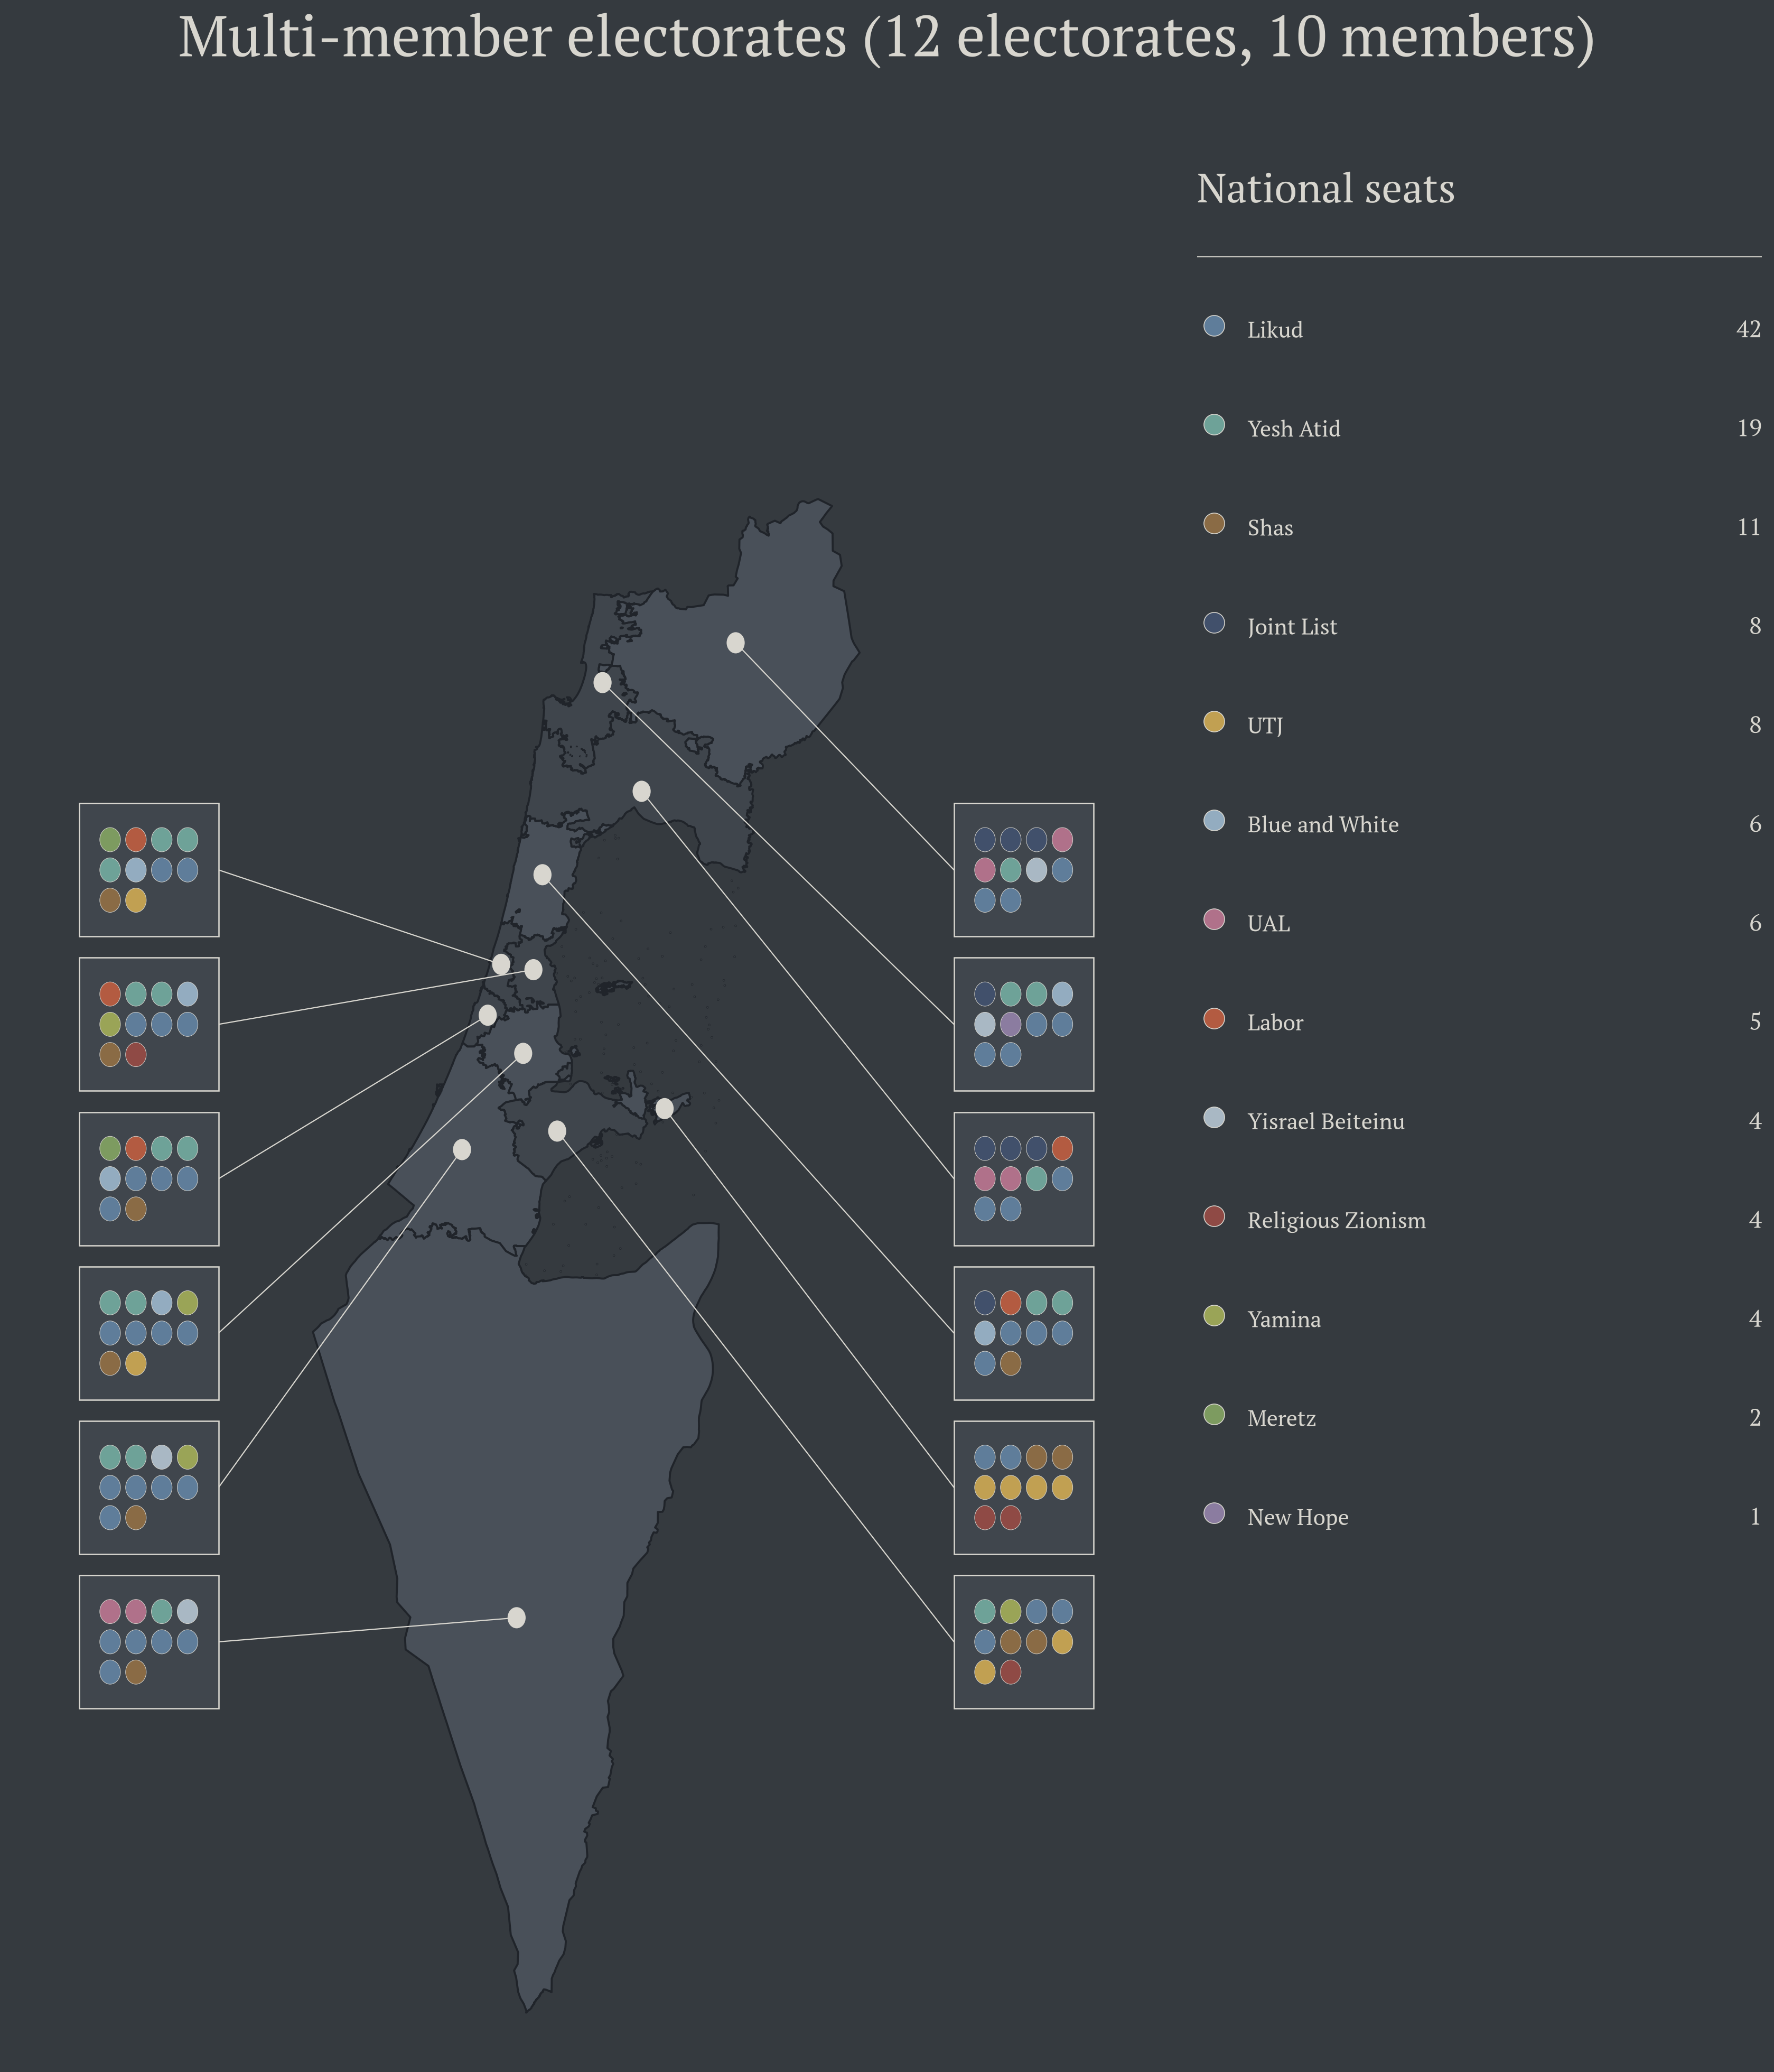
Single-member seats, however you count them, still do throw a lot of votes in the bin. Much of Europe instead uses a compromise: multi-member districts that share out several seats each, in proportion to the votes. So I generalised the algorithm above and instead of 120 tiny districts, clustered the country into fewer, bigger ones, give each a handful of seats, and hand those out proportionally within each district using the D’Hondt method, which I was familiar with from Tasmanian elections. The rule is simple: you give out seats one at a time, each going to whichever party currently has the best votes-per-seat-it-has-already-won.
1def dhondt(votes, seats):
2    won = {p: 0 for p in votes}
3    for _ in range(seats):
4        winner = max(votes, key=lambda p: votes[p] / (won[p] + 1))
5        won[winner] += 1
6    return won
At one seat per district we are back to single-member first-past-the-post. As the districts get bigger, the big party’s unfair bonus melts away and the parties that were shut out entirely start climbing back toward their real share. And at the far extreme, all 120 seats in a single national district, you have pure nationwide proportional representation: almost the actual system Israel already uses, without its 3.25% minimum electoral threshold.
The code is all on GitHub. If you want to pick a fight with my preference-flow assumptions, or with the compromises I made on contiguity, please do — I would genuinely love to see someone take it further.